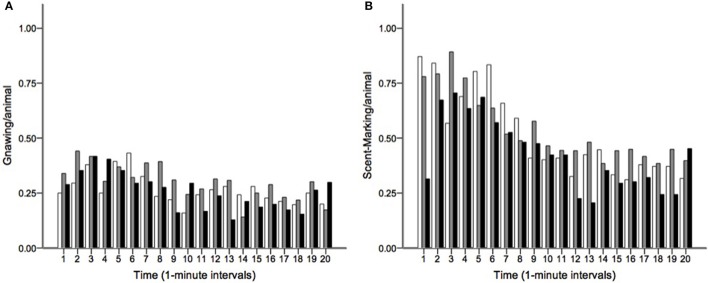
Figure 4.
The distribution of (A) gnawing and (B) scent-marking across the 20-min morning (white), midday (gray), and afternoon (black) testing sessions. The mean number of gnaws and scent-marks per animal are shown at 1-min intervals, indicating that both behaviors occurred at greater frequency at the beginning of the trials.

