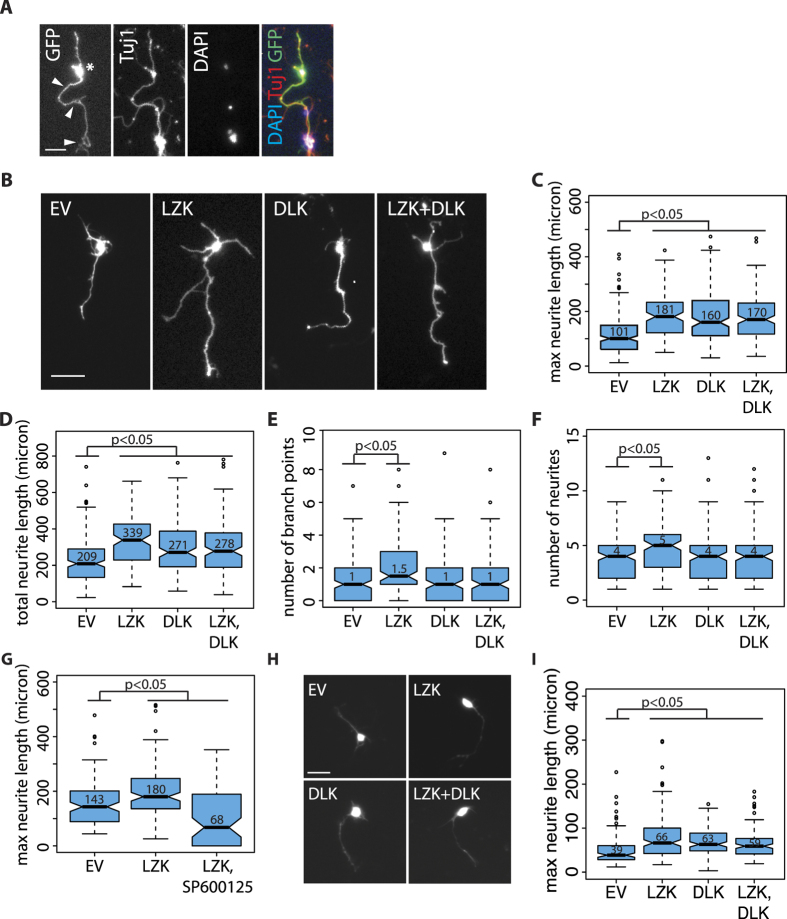
Figure 4. LZK overexpression enhances axon growth in mouse central nervous system neurons.
(A) For in vitro axon growth assays of CGNs, axon lengths of GFP and TuJ1-double positive cells indicative of pBI expression and neuronal identity respectively were quantified. Measurement was based on GFP. Asterisk marks cell body; white arrowheads point to the longest axon. Scale bar = 20 μm. (B) CGNs from wild-type mice were transfected with the indicated pBI plasmids. Images show GFP-positive CGNs with maximum axon lengths representative of the median values in the corresponding conditions. Scale bar = 50 μm. (C–F) Boxplots quantify maximum axon lengths (C) total neurite lengths (D) number of branch points (E) and number of neurites per neuron (F) in CGNs transfected with the indicated pBI vectors. For all boxplots, median values for each condition are shown within graphs. EV indicates empty vector. All boxplot edges extend to the 25th and 75th percentiles; whiskers extend to non-outliner extremes; points beyond whiskers represent outliners. p-values by Wilcoxon test; n = 120–160 neurons per condition. (G) Boxplot quantifies maximal axon growth of P7 CGNs treated with 25 μM JNK inhibitor SP600125 upon transfection with the indicated pBI vectors. EV indicates empty vector. (H) Hippocampal neurons isolated from wild-type postnatal day 6 (P6) mice were transfected with the indicated pBI plasmids. EV is empty vector negative control. Images show GFP-positive hippocampal neurons indicative of transfection with pBI vectors. Scale bar = 20 μm. (I) Boxplot quantifies maximum axon lengths in hippocampal neurons transfected with the indicated pBI vectors shown in (H).

