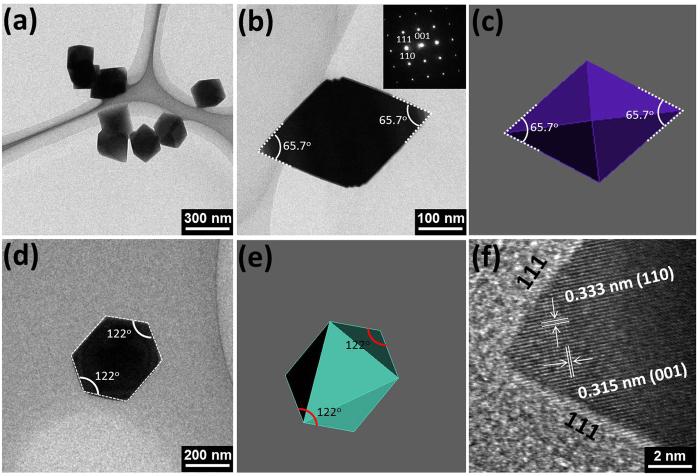
Figure 3. TEM images of prepared samples.
(a) TEM image of SnO2 octahedrons. (b) low-magnification TEM image of a SnO2 octahedron viewed along the {110} direction (inset shows the corresponding SEAD pattern) with (c) its schematic model enclosed by {221} facets. (d) TEM image of the same SnO2 octahedron projected in the {111} direction with (e) its schematic model. (f ) HRTEM image taken from the top apex of SnO2 octahedron enclosed by {221} facets.

