Figure 5.
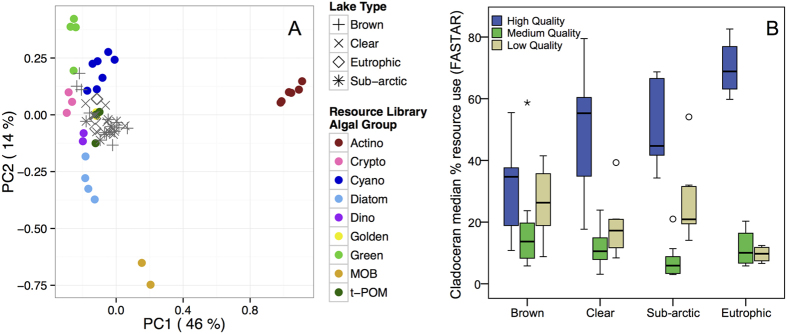
(A) Principal components analysis (PCA) visualizing the multivariate fatty acid resource-library of experimentally fed Daphnia fed known basal end-members and the wild cladocerans collected in the study lakes. Each colored filled circles is the mean fatty acid profile of Daphnia fed a different basal taxon within each of the nine end-member groups [abbreviations: Actino (Actinobacteria); Crypto (Cryptophyceae); Cyano (Cyanophyceae); Diatom (Heterokontophyta); Dino (Dinophyceae); Golden (Synurophyceae); Green (Cryptophyceae); MOB (methane oxidizing bacteria); t-POM (terrestrial particulate organic matter, Plantae)]. Gray symbols are the fatty acid profiles of wild cladocerans collected in each of the 4 lake types. The total variation explained by each PC is displayed on the axes. PC3 (not presented) explained 12% of the total variation. (B) The contribution (Boxplots with median, 25th and 75th percentiles, with whiskers for 5th and 95th percentiles) of diet nutritional quality for Daphnia was divided into high (phytoplankton with EPA), intermediate (phytoplankton with high levels of ALA) and poor (low content of ω-3 fatty acids; Actinobacteria, MOB and t-POM) quality diets, as modeled by FASTAR.

