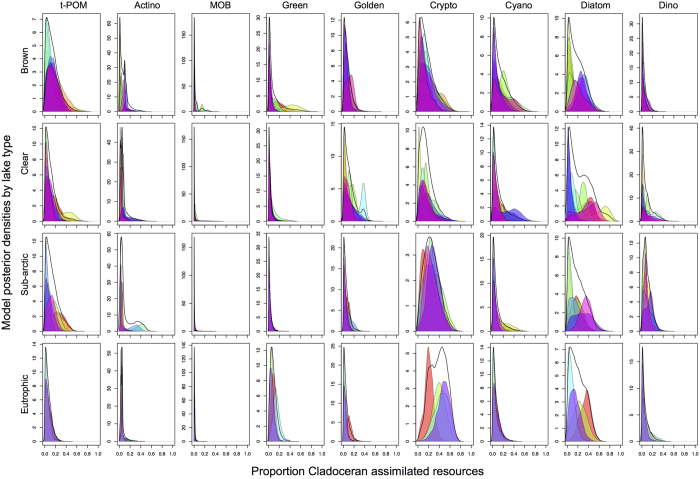
Figure 6. FASTAR mixing model estimates of the proportional assimilation of basal resources by wild cladocera from 9 basal resource groups at the four lake types (rows).
The model was run using all 24 fatty acids in the profiles of Daphnia fed known end-member diets (see Methods; Fig. 4A) in independent feeding trials. Each plot shows the posterior density (y-axis) of results from the mixing model for a given dietary source (x-axis). The FASTAR solution for Daphnia from each individual lake are reported as different colored distributions for each replicate [brown lakes (n = 10); clear lakes (n = 10); subarctic lakes (n = 7); and eutrophic lakes (n = 4)], along with median ‘lake-level’ solution compiled from all replicates within that lake type (non-colored distribution). Resource group names (columns) follow abbreviations defined in the Fig. 5 caption.

