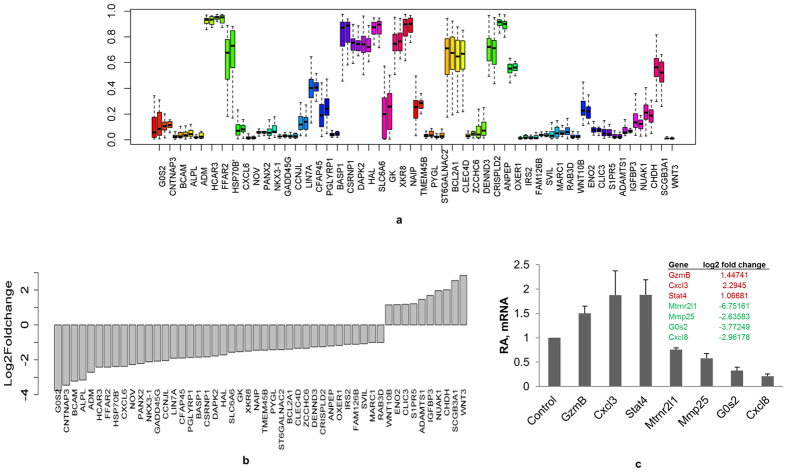
Figure 4. DNA methylation level has a trend that corroborates gene expression.
There is a clear trend showing higher DNA methylation and lowered mRNA levels and vice-versa for the corresponding gene. (a) DNA methylation levels of the select genes presented as box plot. On x-axis, the names of gene are provided and y-axis provides the average β- values of DNA methylation. The two bars corresponding to each gene represent the DNA methylation level for control followed by PTSD patient in a left to right direction. (b) Transcript levels (y-axis: log 2 fold change values) of genes, after RNA-Seq analysis, listed in Fig. 4a. (c) Real time PCR validation of differentially expressed genes. To validate the RNA-Seq results, qRT-PCR was performed for seven representative genes with cDNA prepared from total RNA obtained from PBMCs of 24 control and 24 PTSD patients. The values are relative abundance (RA) values after qRT-PCR. The table inside the figure provides log 2 fold change values of the respective genes after RNA-Seq analysis. The error bars indicate standard error.

