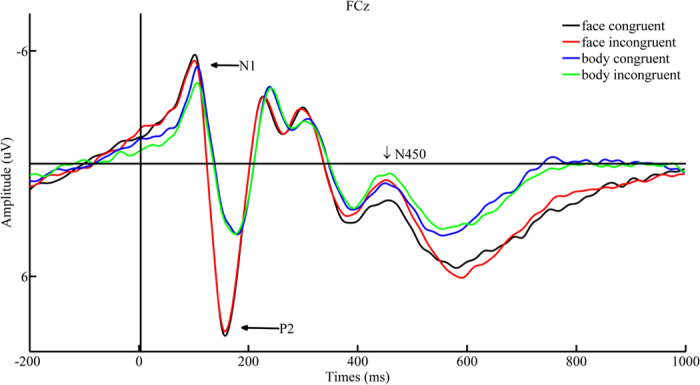
Figure 2. Grand-averaged waveforms in the frontal-central region.

Grand-averaged waveforms at the “FCz” electrode site for face-congruent (black solid line), face-incongruent (red solid line), body-congruent (blue solid line), and body-incongruent (green solid line) trials as a function of time. The X-axis represents time within a trial, where 0 indicates the onset of the target stimulus. The Y-axis represents the wave amplitude range.
