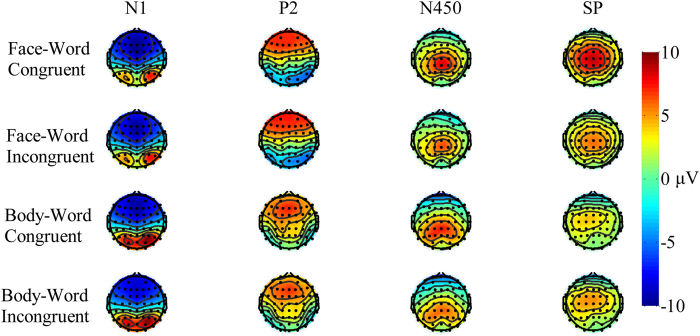
Figure 3. N1, P2, N450, and SP responses across tasks.
Topographical distribution of N1 (80–130 ms), P2 (140–230 ms), N450 (400–550), and slow potentials (SP; 580–700 ms) averaged across participants for the face-congruent, face-incongruent, body-congruent, and body-incongruent conditions. Black dots represent scalp electrode positions. Contours connect points of equal amplitude on the waves.

