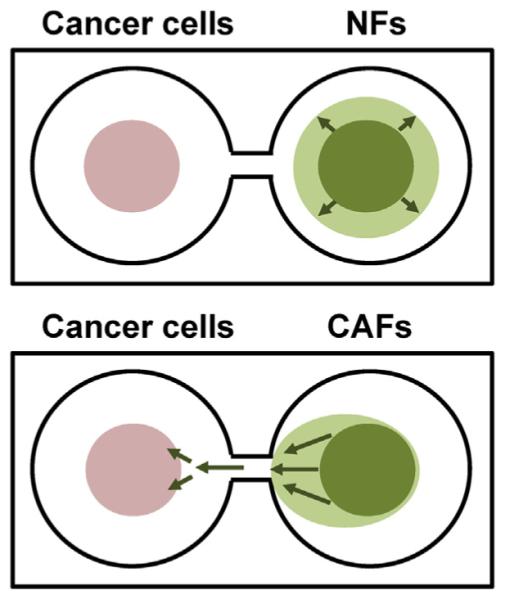
Fig. 3.

Cartoons illustrating distribution of breast cancer cells and normal fibroblasts (NFs; upper) or carcinoma-associated fibroblasts (CAFs; lower) grown in parallel cocultures in TAME chambers. Breast cancer cells (pink circles) and fibroblasts (green) were imaged live to follow cell:cell interactions and movement over a 63 day period. Green arrows indicate the observed migration of fibroblasts over this period. CAFs, but not NFs, migrated preferentially toward breast cancer 3D structures.
