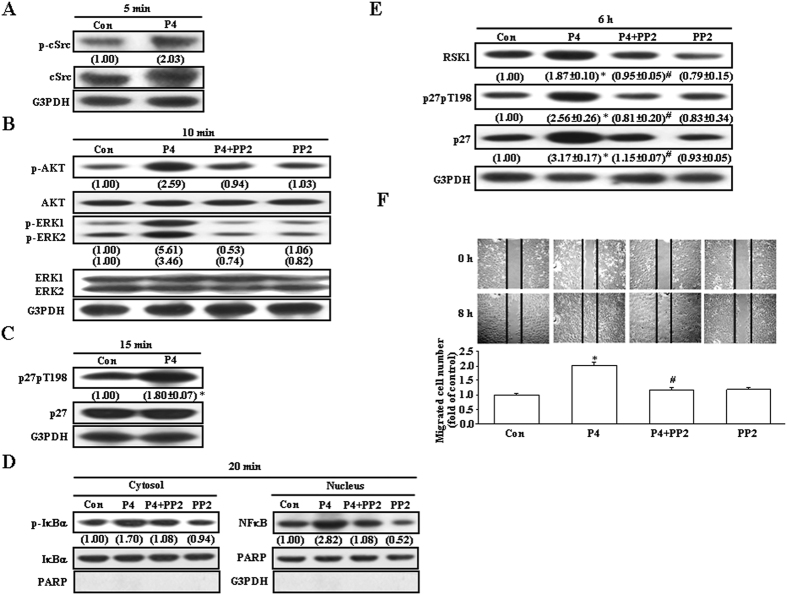
Figure 3. Role of the cSrc-mediated pathway in the P4-induced migration enhancement in T47D cells.
(A) Treatment with P4 (50 nM) for 5 min induced cSrc activation in T47D cells. (B) Treatment with P4 (50 nM) for 10 min induced activations of AKT and ERK1/2, and these effects were abolished by pre-treatment of the cell with a cSrc antagonist, PP2 (200 nM). (C) Treatment with P4 (50 nM) for 15 min increased the level of p27pT198. (D) Treatment with P4 (50 nM) for 20 min induced IκBα activation and NFκB nuclear translocation, and these effects were abolished by pre-treatment of the cell with PP2. (E) Treatment with P4 (50 nM) for 6 h induced increases in the levels of RSK1, p27 and p27pT198 protein. (F) The P4 (50 nM)-induced migration enhancement was abolished by pre-treatment of the cell with PP2. Western blot data are representative of 2 (A,B,D) or 3 (C,E) independent experiments with similar results. Values shown in parentheses represent the quantified results adjusted with total IκBα and PARP for p-IκBα in the cytosol and NFκB in the nucleus, respectively (D), with their own total protein (A–C), or with G3PDH (E), and are expressed as ratio over its own control. In (C,E,F), values represent the means±s.e.mean. (n = 3). *P < 0.05 different from control group. #P < 0.05 different from P4-treated group. Con, control.

