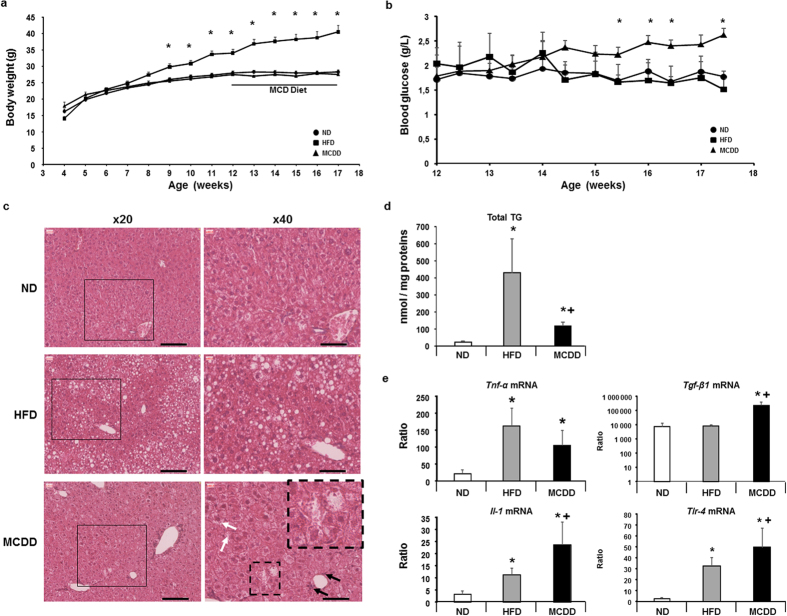
Figure 1. Characteristics of mouse models fed a high-fat diet and a methionine-choline deficient diet.
(a) Body weights of mice fed a high-fat diet 60% (HFD, ■), a methionine choline deficient diet (MCDD, ▲) and their respective control groups fed a normal diet (ND, •). Mice on MCDD were fed during 5 weeks (black bare). (b) Blood glucose follow-up during the 5 weeks when mice were fed a MCDD (▲) compared to HFD (■) and their respective control groups fed a ND (•). (c) Hematoxylin and eosin staining of livers from mice fed a HFD, a MCDD and their respective controls (ND). Left panels are 20x magnification and black square area of 40x magnification on the right panels. Scale bares: 100 μm. Black arrows show inflammatory cells and black dash square focus on hepatocytes presenting ballooning and Malory’s body (magnification of black dash square focus on upper-right panel) with presence of hepatic lipid droplets characteristic of NASH. (microvesicular steatosis; white arrows). (d) Total hepatic triglycerides (TG) in mice fed a HFD and a MCDD compared to their respective control (ND). (e) Hepatic mRNA gene expression levels involved in the inflammatory process and partially controlled by lipids. Data are means ± SEM. *p < 0.05, by unpaired t-test compared to mice fed a ND and +p < 0.05, by unpaired t-test compared to mice fed a HFD, after ANOVA-test. ND n = 10, HFD n = 5, MCDD n = 5. Il: interleukin; Tgf: transforming grouth factor; Tlr: toll-like receptor; Tnf: tumor necrosis factor.

