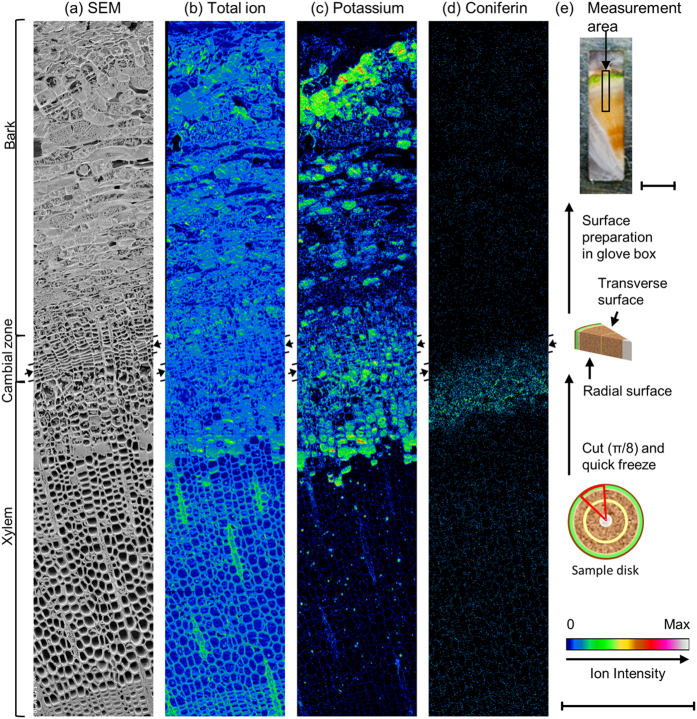
Figure 2. Transverse surface images of freeze-fixed ginkgo stem by cryo-TOF-SIMS/SEM.
(a) Cryo-SEM image taken after cryo-TOF-SIMS measurement and appropriate freeze-etching. Cryo-TOF-SIMS positive ion images of (b) total ion, (c) K+ at m/z 39, and (d) coniferin at m/z 180. (e) Schematic illustration of sample preparation and the resultant optical microscopic image of transverse surface of freeze-fixed ginkgo stem on a cryo-TOF-SIMS sample holder showing the measurement area (ca. 2.3 × 0.4 mm). Scale bars are 500 μm for (a–d) and 2 mm for (e). Arrows at both sides of images suggest the line of the cambial zone. Cryo-SEM images before and after freeze-etching are displayed in Supplementary Fig. 6. Cryo-TOF-SIMS images of mono-/di- saccharides are shown in Supplementary Fig. 7.

