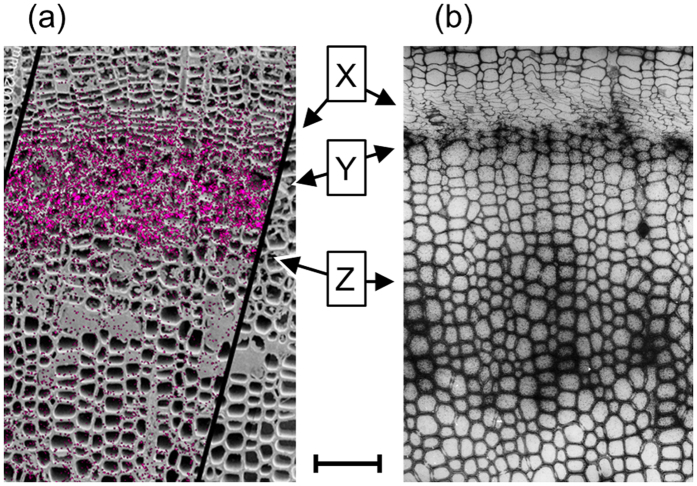
Figure 6.
Comparative visualization of (a) the overlay image of cryo-TOF-SIMS m/z 180 ion (red) on the cryo-SEM illustrating endogenous coniferin distribution in the freeze-fixed ginkgo stem and (b) 14C microautoradiography showing 14C-lignin introduced by 14C-coniferin administration to ginkgo (rearranged from the previous research by Fukushima and Terashima11). Arrows show the positions of (X) cambial zone, (Y) start of CML lignification, and (Z) start of secondary cell wall lignification. Scale bar is 100 μm.

