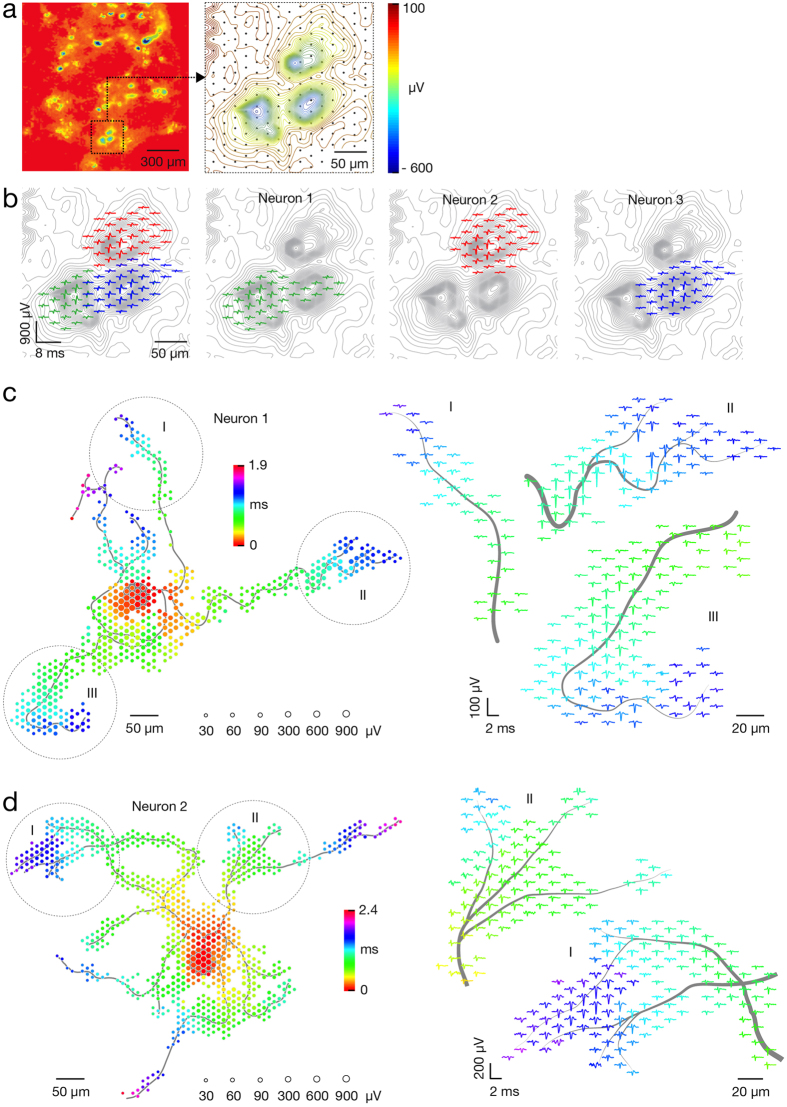
Figure 1. Electrical identification of individual neurons on the array based on their spontaneous activity.
(a) Spontaneous activity map of cortical neuronal culture. Amplitudes of 60–300 APs recorded by each electrode were averaged and color-coded. The selected region of the activity map has been magnified 6 times; averaged signals have been interpolated and are represented through equipotential lines; black dots in the background represent the electrode locations. (b) Footprints of spontaneous AP activity of three neurons (colored in green, red and blue) in the selected region of the activity map in (a). Superimposed (left) and individual electrical activity (labels ‘Neuron 1–3’). (c,d) Spike-triggered-average footprints of ‘Neuron 1’ and ‘Neuron 2’ are presented at the left of (c,d). Circle sizes indicate logarithmically scaled amplitudes of APs, whereas colors indicate occurrence times of negative AP peaks relative to first AP activity of the respective neuron. Three selected regions of each spike-triggered average footprint (labeled I, II and III) are magnified 2.5 times and presented at the right of (c,d). Gray axonal contours serve as guide to the eye and are estimated by observing the spatial movement of signal peaks in consecutive movie frames. The footprints of ‘Neuron 1’ and ‘Neuron 2’ are also presented in Supplementary Movie S1.

