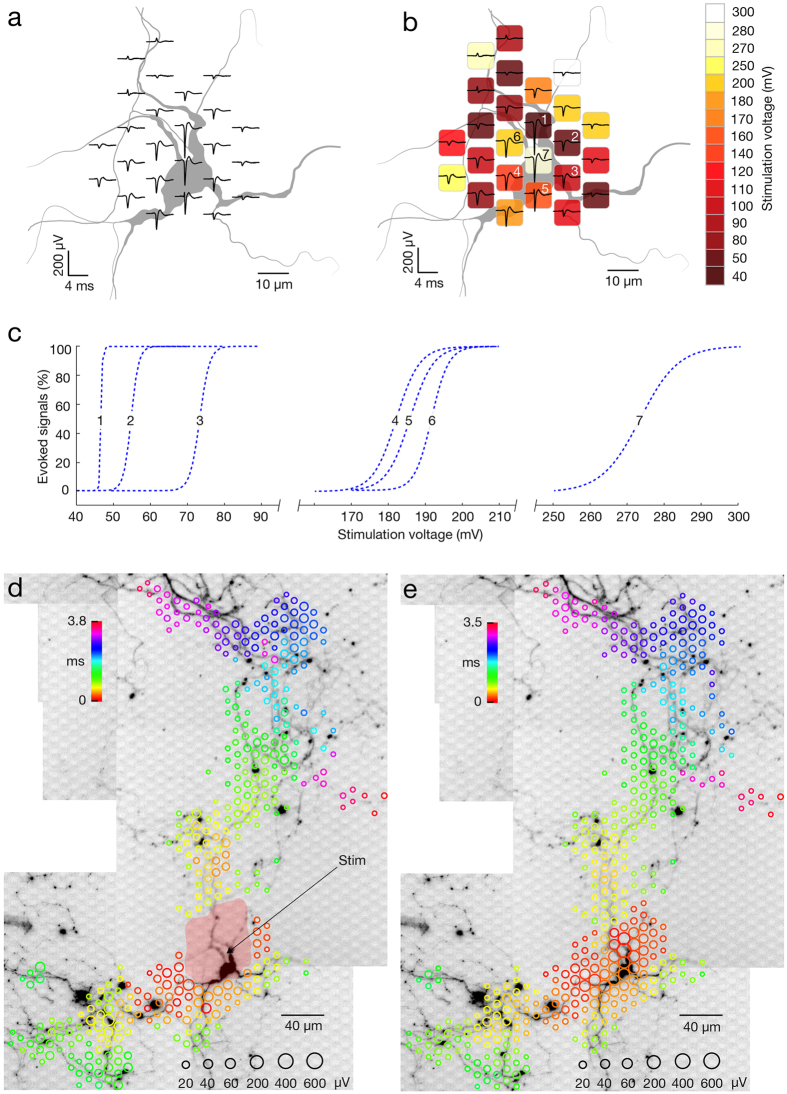
Figure 5. Selective stimulation of single neurons.
(a) Spontaneous activity footprint (black traces) superimposed over the morphology of the respective neuron and its proximal compartments (colored in gray). Neuronal morphology was inferred from a microscopy image of the lipofected neuron. (b) Stimulation map superimposed over the footprint and neuron morphology (same neuron as in A). Site-specific stimulation thresholds are color-coded, and the electrodes in the center of the spontaneous activity footprint are numbered (1–7). (c) Excitability profiles for stimulation through the 7 center electrodes. Numbers correspond to those in (b). (d) Stimulation-triggered footprint superimposed over a micrograph of the corresponding lipofected neuron. Circle sizes indicate logarithmically scaled amplitude of triggered APs, whereas colors indicate the occurrence times of negative AP peaks relative to the stimulation time. The black arrow points to the stimulation electrode for orthodromic stimulation, whereas the pale red patch indicates the area affected by the stimulation artifact. The neuron was selectively stimulated 60 times at 4 Hz at the stimulation threshold value (±50 mV, corresponding to ~31 pC). These data are also presented in Supplementary Movie S5. (e) Spike-triggered average footprint of spontaneous electrical activity superimposed over the micrograph of the same lipofected neuron as in (d).

