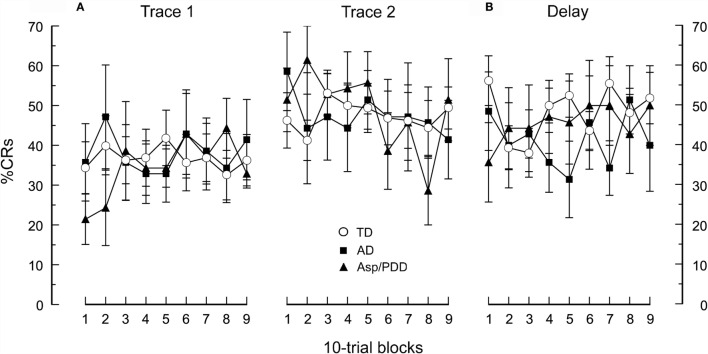
Figure 1.
CR acquisition for the AD, Asp/PDD, and TD groups. (A) During two sessions of trace EBC. (B) During a subsequent session of delay EBC. Mean data are presented in 10-trial blocks. Error bars show ± 1 SEM. Curves showing TD are taken from Oristaglio et al. (1).

