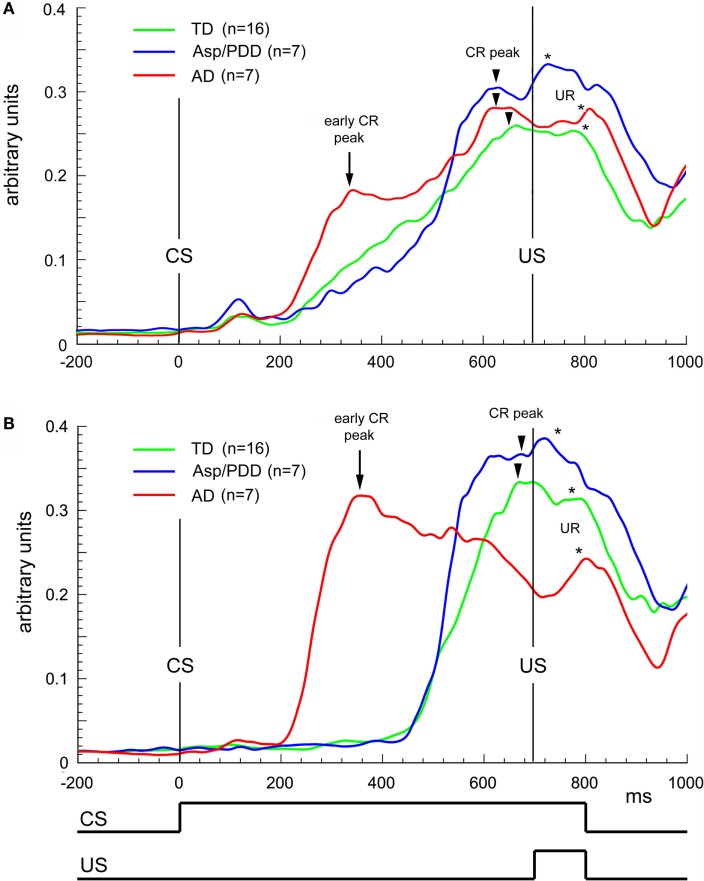
Figure 4.
Waveform analysis during delay EBC. (A) Average CRs during the first 30 trials of delay EBC for TD (green), Asp/PDD (blue) and AD (red) groups. (B) Average of the most prevalent type of CR for each group. Arrows indicate abnormally early CR peaks by the AD group. Arrowheads indicate CR peak close to US onset. Asterisks indicate unconditioned response peaks to the airpuff US. Curves show the mean of all subjects in each group.

