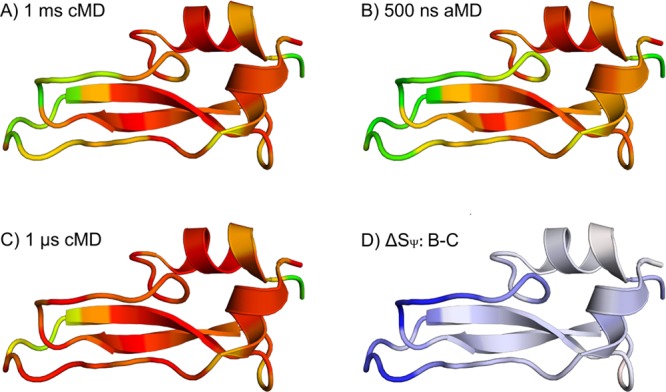
Figure 3.

Flexibility hot spots of BPTI: Residue-wise dihedral entropies for Ψ (SΨ) from the 1 ms cMD (A), 500 ns aMD simulation (B), and 1 μs cMD (C) are projected on the structure of BPTI (PDB-ID: 5PTI). In panels A, B, and C, the color coding ranges from red (SΨ ≤ 30 J/(mol K)) via yellow to green (SΨ ≥ 45 J/(mol K)). Thus, the most rigid residues are pictured in red, whereas the most flexible ones are colored green. Part D shows the differences in SΨ between 500 ns aMD and 1 μs cMD (ΔSΨ = B – C). The color coding in D ranges from red (ΔSΨ ≤ 15 J/(mol K)) to white to blue (ΔSΨ ≥ 15 J/(mol K)); i.e., blue indicates regions where the aMD simulation captures a higher local flexibility. Thus, the cMD simulation clearly underestimates the conformational dynamics of BPTI in the region of residues 10–14 and 32–44.
