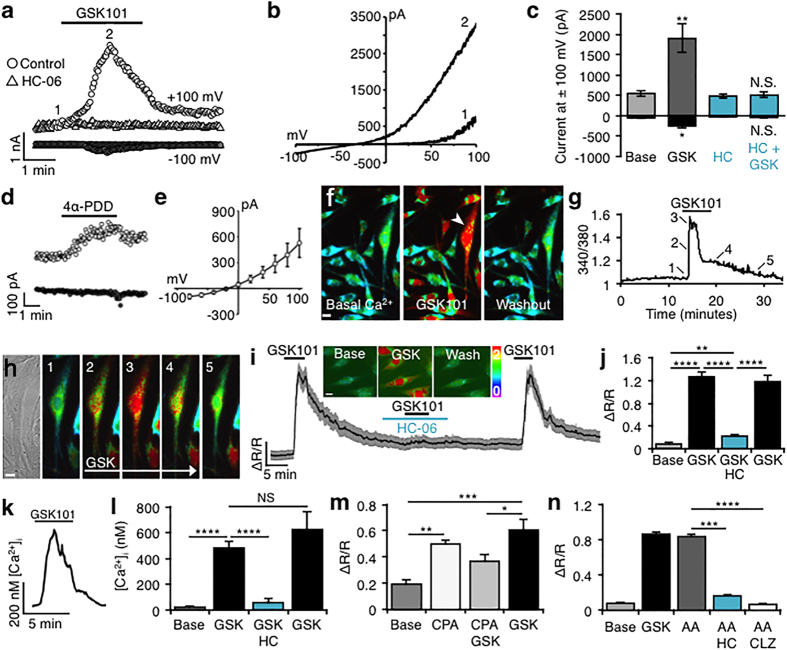
Figure 3. TRPV4 is functional, mediating transmembrane current and [Ca2+]i elevations in hTM cells.
(a) Time course of GSK101-evoked currents at +100 mV (open circles) and −100 mV (closed circles). Block by HC-06 (1 μM) shown as open and closed triangles, respectively. Acquisitions of I-V data denoted by numerals “1” and “2”. (b) Representative I-V curves of pre-agonist (1) and GSK101-induced (2) responses from (a). (c) Cumulative data for GSK101 (n = 9) and GSK101+ HC-06 (n = 12) currents at ±100 mV. (d) Time-course for 4α-PDD (1 μM) -evoked currents at Vh = − 100 mV (filled symbols) and +100 mV (open symbols). (e) Averaged I-V relationship of 4α-PDD -induced currents obtained by subtraction of the pre- application response from peak response (n = 9). (f) Wide-field view of Fura-2-loaded hTM cells stimulated with GSK101 and washout. Scale bar = 10 μm. (g) Time course of the [Ca2+]i signal for the arrowhead-marked cell in (f). (h) Transmitted & time lapse images from the cell marked in (f). Scale bar = 10 μm. (i,j) hTM. GSK101 (25 nM) elevates [Ca2+]i, inhibition by HC-06 and washout. Gray bars denote SEM. Inset: representative ratiometric images. Scale bar = 10 μm. (k) Time course of calibrated [Ca2+]i increase in a pTM cell. (l) Quantification of [Ca2+]i responses from pTM cells in the presence/absence of HC-06 washout. (m) hTM. CPA (5 μM) elevates [Ca2+]i levels above baseline fluctuations, resulting in suppression (P < 0.05) of the TRPV4 response. (n) hTM. AA (50 μM) evokes responses that are blocked by HC-06 (1 μM) and CTZ (10 μM).

