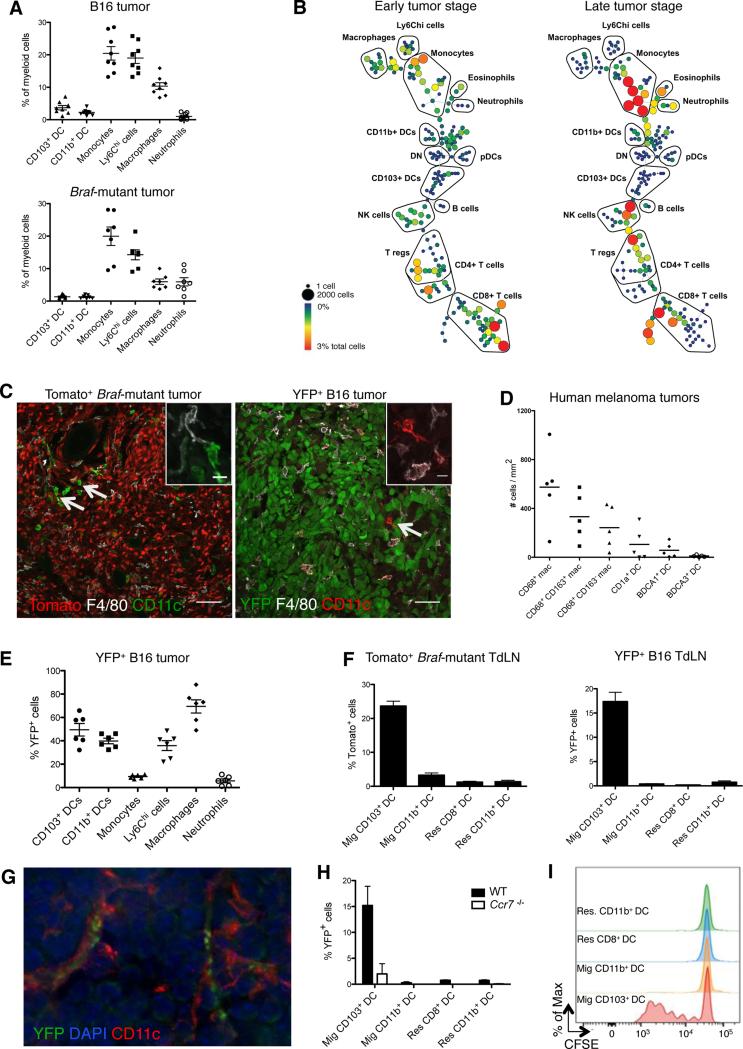
Figure 1. CD103+ DCs uniquely transport intact antigens to the tumor-draining lymph nodes.
B16 and Braf-mutant tumors and LN were analyzed at day 15 and 25, respectively, unless specified otherwise.
(A) Frequency of each myeloid cell population among total myeloid cells infiltrating B16 (n=8) and Braf-mutant tumors (n=7). See Figure S1A for gating strategy. Shown is the mean ± SEM of 2-3 independent experiments.
(B) CyTOF analysis of tumor-infiltrating immune cells at early (day 10) and late (day 16) stages of B16 tumor growth. Gated live CD45+ cells were clustered using SPADE based on 27 markers. Trees are representative of 2 experiments with similar results.
(C) Representative confocal images showing CD11c+ F4/80− DCs and macrophage/monocyte-derived CD11c+/− F4/80+ cells in Tomato+ Braf-mutant and B16-YFP tumors, scale bar: 50μm. The right upper corners show magnification of a DC and a macrophage/monocyte-derived cell, scale bar: 10μm. Arrows show rare tumor-infiltrating DCs.
(D) Density of macrophages and DCs infiltrating human melanoma primary tumors (n=5) quantified from tumor sections stained using multiplexed immunohistochemistry (Figure S1D).
(E) Frequency of YFP+ cells infiltrating B16-YFP tumors. Shown is the mean ± SEM of 2 independent experiments (n=6).
(F) Frequency of Tomato+ and YFP+ cells in skin migratory (CD11c+MHCIIhi) and LN-resident (CD11chiMHCII+) DCs in the LN draining Tomato+ Braf-mutant (left panel, n=9) and B16-YFP tumors (right panel, n=12). Shown are the mean ± SEM of 4 independent experiments.
(G) Representative image of a CD11c+ cell harboring YFP+ vesicles in the LN draining B16-YFP tumors.
(H) Frequency of YFP+ cells among migratory DCs isolated from the LN draining B16-YFP tumors in WT or Ccr7−/− mice (n=2).
(I) Migratory and LN resident DCs were sorted from the LN draining B16-OVA tumors and co-cultured with CFSE-labeled OT-I T cells (DC-T ratio = 1/3). Three days later, the proliferation of OT-I T cells was determined by CFSE dilution. Histograms represent one of two independent experiments with similar results.
See also Figure S1.

