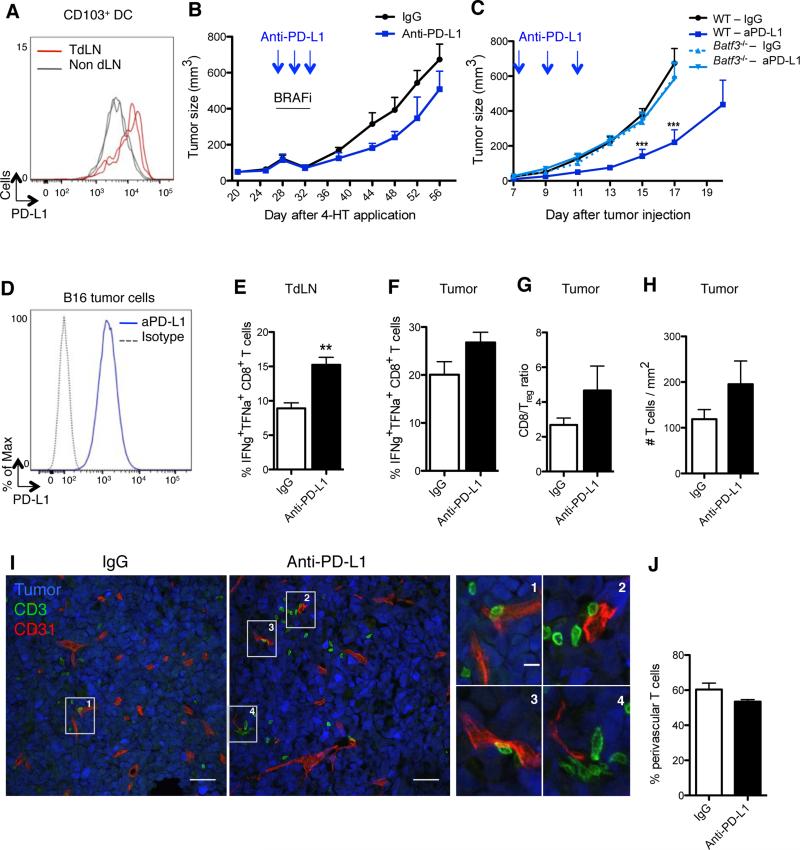
Figure 2. CD103+ DCs control tumor response to PD-L1 blockade.
(A) PD-L1 expression on CD103+ DCs purified from B16 TdLN (red lines) and non-draining LN (grey lines), day 15 after tumor challenge. Representative flow cytometry histogram of 2 experiments.
(B) Braf-mutant mice were treated i.p. with either anti-PD-L1 or a control mAb on days 28 (tumor size: 100-150μm3), 30 and 32 after 4-HT topical application. All mice were treated with BRAF inhibitors from day 28 to 32. Shown is mean ± SEM of 2 independent experiments (n= 5-6).
(C) B16 tumor-bearing WT or Batf3−/− mice were treated i.p. with either anti-PD-L1 or a control mAb on days 7, 9 and 11 after tumor challenge. Tumor growth was followed for 17-20 days. Shown is the mean ± SEM of 2 independent experiments (n=5-8).
(D) PD-L1 expression on cultured B16 tumor cells.
(E-J) Mice were inoculated with B16 tumor cells and treated as in (C).
(E-F) On day 15 mice were sacrificed and CD8+ T cells from TdLN (E) or tumor (F) were analyzed for the production of IFNγ and TNFα following 3-hr PMA/ionomycin stimulation. Shown is the mean ± SEM of 2 independent experiments (n= 4-5 mice).
(G) CD8+ T cell/Treg cell ratio 15 days after tumor challenge is shown as the mean ± SEM of 2 independent experiments (n=4-5).
(H) B16-YFP tumors were harvested on day13 (2 days after the last injection of anti-PD-L1 or control mAb) and stained with anti-CD3 mAb. The density of CD3+ T cells infiltrating B16-YFP tumors was automatically quantified with Cell Profiler software from confocal images. Shown is the mean ± SEM of 3 independent experiments (n=4-6). 12-16 tiled 20x images were analyzed per animal.
(I) B16-YFP tumors (here in blue) were harvested and frozen on day 13 and stained with for T cells (CD3+, green) and blood vessels (CD31+, red). Panels show confocal images (scale bar: 50μm) representative of 3 experiments with similar results. Right panels show higher magnifications of T cells surrounding vessels (scale bar: 10μm).
(J) As in (I), but the percentages of CD3+ T cells found in perivascular areas (≤30μm from a CD31+ vessel) were quantified using Cell Profiler software. Shown is the mean ± SEM of 3 independent experiments (n=4-6).
See also Figure S2.

