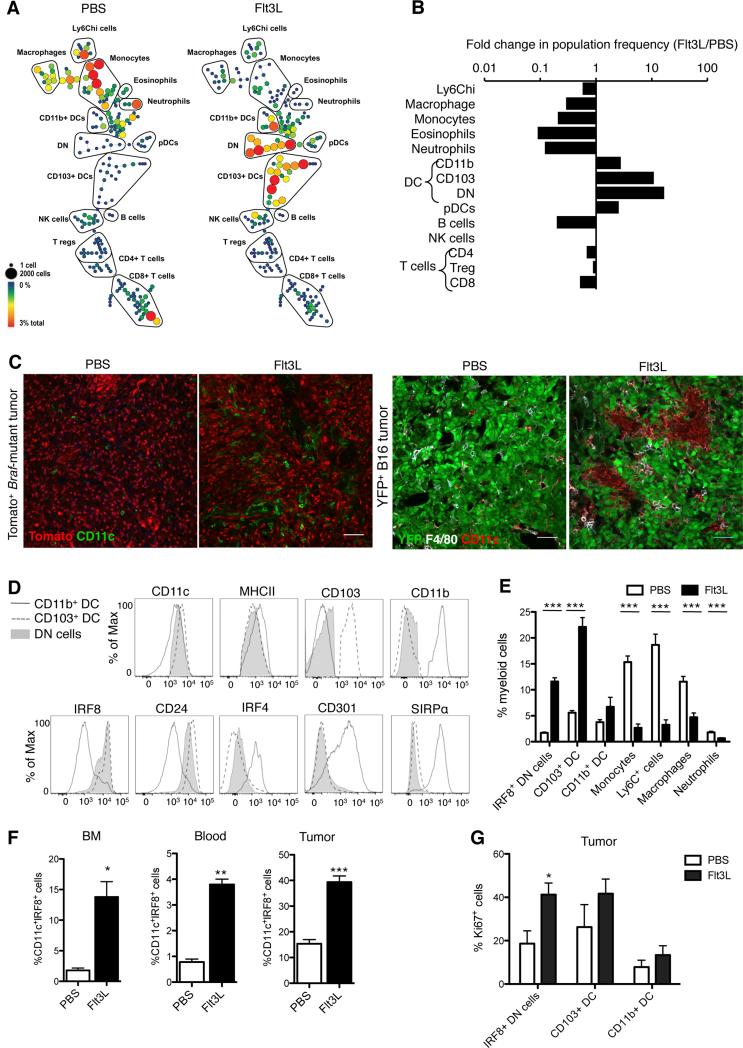
Figure 3. Flt3L injections dramatically expand CD103+ DC progenitors in the bone marrow and promote their accumulation and expansion in the tumor mass.
(A) CyTOF analysis of tumor-infiltrating immune cells on day 13 after B16 tumor challenge in mice treated i.p. for 9 consecutive days starting at day 3 post tumor injection with 30μg FL or PBS. SPADE trees were colored by relative population frequency out of total live CD45+ cells. Five mice were pooled to build each SPADE tree. Trees are representative of 2 experiments with similar results.
(B) Fold changes in relative frequency of immune cell populations (identified by SPADE clustering performed in A) between FL- and PBS-treated mice.
(C) Representative confocal images of DCs infiltrating tomato+ Braf-mutant tumors (red) and B16-YFP tumors (green) treated with 9 daily injections of FL or PBS starting on day 18 after 4-HT topical application (Braf-mutant) or 3 days after tumor challenge (B16). Tumor biopsies were isolated and frozen 30 days (Braf-mutant) and 15 days (B16) after tumor challenge. In Braf-mutant tumors, DCs were identified as CD11c+ cells (green) whereas in B16 tumor DCs were identified as F4/80−CD11c+ (red). Scale bar: 50μm.
(D) Mice were treated as in A. Histograms show the expression of cell surface markers or transcription factors in CD103+ DCs (dashed line), CD11b+ DCs (grey line) and MHCIIhiCD11c+Ly6C−CD64−CD103−CD11b− double negative cells (DN: full grey) infiltrating B16 tumors on day 13 after tumor challenge. Results shown are representative histograms of 2 experiments.
(E) Frequency of myeloid cell populations infiltrating B16 tumors in mice treated with FL or PBS as in A. Results shown are the mean ± SEM of 3 independent experiments with a total of 8 mice.
(F) Frequency of MHCIIhiCD11c+Ly6C−CD64−CD103−CD11b−IRF8+ (IRF8+ DN) cells in bone marrow (BM), blood and tumors of B16 tumor-bearing mice analyzed 2 days after 9 daily injections of FL or PBS. Shown is the mean ± SEM of one experiment (n=5).
(G) Frequency of Ki67+ cells among IRF8+ DN cells, CD103+ DCs and CD11b+ DCs infiltrating B16 tumors site analyzed 2 days after 9 daily injections of FL or PBS. Shown is the mean ± SEM of 2 independent experiments (n=4).
See also Figure S3.

