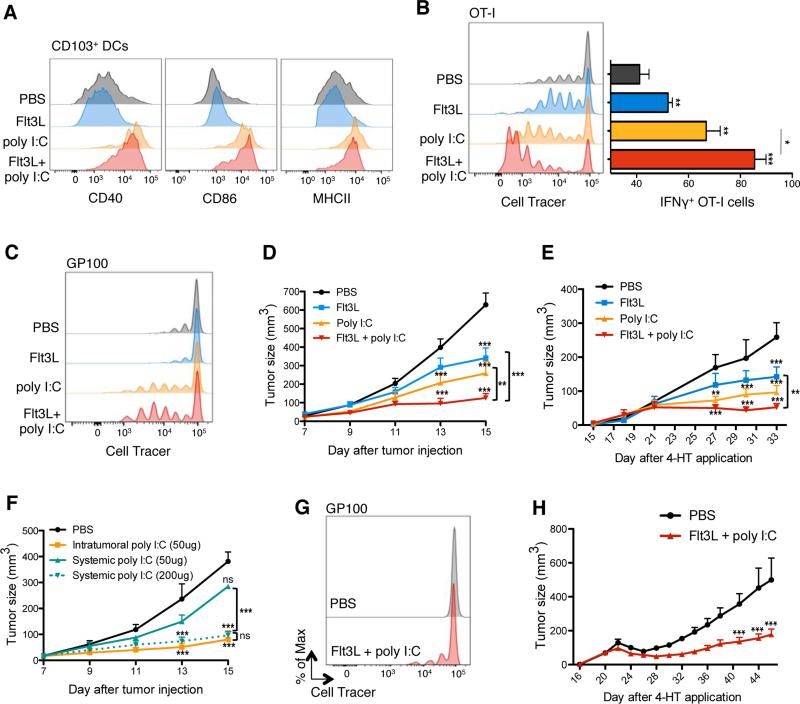
Figure 4. Combination of Flt3L and in situ TLR3 ligand promotes the regression of B16 and Braf-mutant lesions.
(A) Expression of CD40, CD86 and MHCII on tumor-infiltrating CD103+ DCs upon treatment with i.p. FL and/or pIC or PBS as a control (treatment scheme in Figure S4A). Shown are representative histograms of 2 independent experiments.
(B) B16-OVA bearing mice were treated with FL and pIC as in (A). At day 11, mice were adoptively transferred with Violet-labeled OT-I T cells, 2 hrs after the last injection of pIC/PBS. TdLN were harvested 3 days after OT-I T cell transfer and proliferation was assessed based on Violet dilution using flow cytometry. Left panels show a representative histogram showing violet cell dilution in gated transferred OT-I T cell. Bar graph (right panel) shows the mean ± SEM IFNγ production by gated OT-I cells after in vitro re-stimulation with ovalbumin257-264 peptide for 4 hrs.
(C) B16-tumors bearing mice were treated with FL and pIC as in (A) and adoptively transferred with Violet-labeled gp100-specific T cells. TdLN were harvested 4 days after i.v. injection of gp100-specific T cells and their proliferation was assessed based on Violet dilution using flow cytometry. Shown is a representative histogram of 2 independent experiments.
(D) B16 tumor-bearing mice were treated with FL, pIC, FL+pIC or PBS as shown in (A). Graph shows the mean tumor growth ± SEM of 4 independent experiments (n=7-12).
(E) Braf-mutant tumor bearing mice were treated as in (A), with FL injections starting on day 15 after 4-HT application. Graphs show the mean tumor growth ± SEM of 2 independent experiments (n=5).
(F) B16 tumor-bearing mice were treated with PBS (control) or pIC (50μg or 200μg) intratumorally or i.p.. Graph shows the mean tumor growth ± SEM of 2 independent experiments (n=3-6 mice).
(G) Braf-mutant tumor mice were treated as described in Figure S4B. On day 26, 2h after the last injection of pIC/FL/PBS, mice were adoptively transferred with Violet-labeled gp100-specific T cells. TdLN were harvested 4 days after gp100-specific T cell transferred cells and proliferation was assessed through Violet-Cell trace dilution. Shown is a representative histogram of 2 independent experiments.
(H) Braf-mutant tumor mice were treated as described in Figure S4B. Graph shows the mean tumor growth ± SEM of 2 independent experiments (n=5-6 mice).
See also Figure S4.

