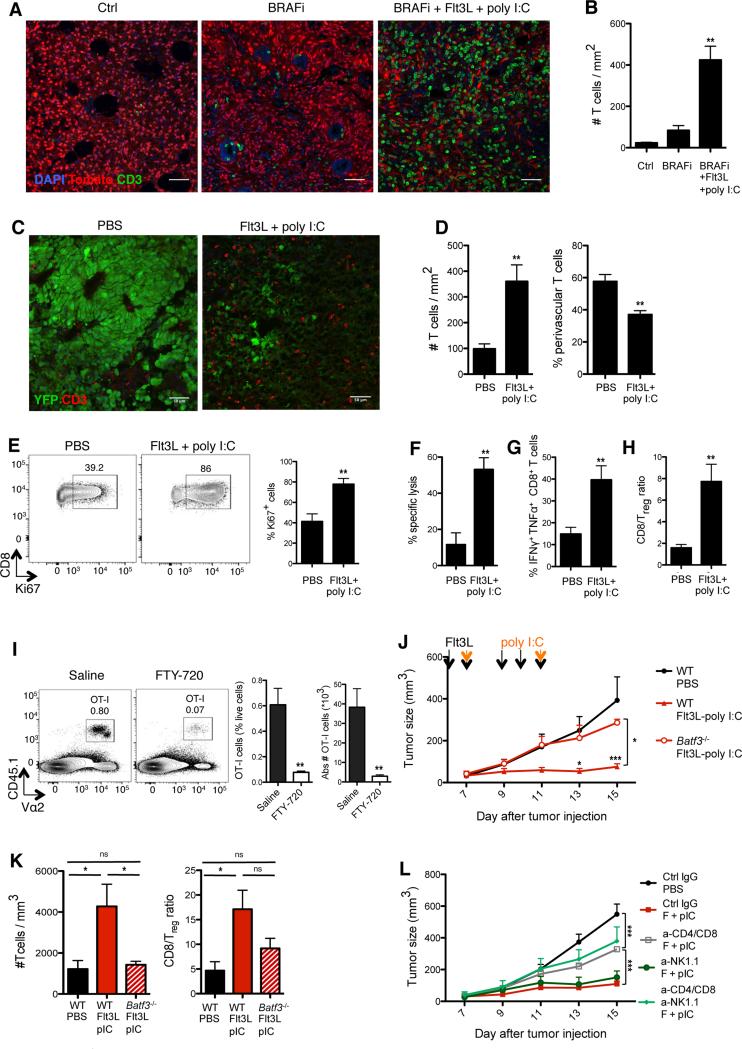
Figure 5. Therapeutic immunity induced by Flt3L-poly I:C combined therapy requires CD103+ DCs and type I IFN.
(A-B) Tomato+ Braf-mutant tumor mice were treated as described in Figure S4B. Two days after the end of treatment, tumors were harvested and frozen. (A) Representative confocal images of CD3+ T cells (green) infiltrating tumors from the indicated treatment groups. (B) CD3+ T cell density was quantified from confocal images using Cell Profiler software. Shown is the mean ± SEM of 2 independent experiments (n= 3-4;12-16 tiled 20x images were analyzed per animal). (C-D) B16-YFP tumor-bearing mice were treated as described in Figure S4A. Two days after the end of treatment, tumors were harvested and frozen. (C) Shown are representative confocal images of CD3+ T cells (red) infiltrating tumors treated with PBS or FL-pIC. (D) CD3+ T cell density (left) and proportions of perivascular CD3+ T cells (<30um from CD31+ vessels; right) were quantified from confocal images using Cell Profiler software. Shown is the mean ± SEM of 4 independent experiments (n= 4-6; 12-16 tiled 20x images were analyzed per animal).
(E-H) B16 tumor-bearing mice were treated as in Figure S4A and tumor-infiltrating T cells were analyzed at day 15, unless specified otherwise. (E) Representative dot plots (left) and quantification (right) of the frequency of tumor-infiltrating CD8+ T cells expressing the cell cycle protein Ki67. Graph shows the mean ± SEM of 2 independent experiments (n= 4). (F) WT splenocytes were incubated in vitro with ovalbumin257-264 peptide and labeled with high concentration of CFSE (CFSEhi) or incubated with control medium and labeled with low CFSE concentration (CFSElow). Same numbers of CFSEhi and CFSElow splenocytes were coinjected into B16 tumor-bearing mice treated with FL+pIC or PBS at day 16 and analyzed 24hrs later. Shown is the mean ± SEM of one experiment (n=4-5). (G) CD8+ T cells were analyzed for IFNγ and TNFα production after PMA/ionomycin stimulation. Shown is the mean ± SEM of 4 independent experiments (n=8). (H) Tumor-infiltrating CD8+ T cell/Treg cell ratio as the mean ± SEM of 4 independent experiments (n=8).
(I) Mice bearing B16-OVA tumors received daily FL injections from day 5 to 9 post- tumor challenge followed by one intratumoral injection of pIC at day 9. Two hours after the pIC injection, tumor-bearing mice were injected with 3×10⁶ naïve tumor antigen-specific CD8+ T cells (OT-I) in the presence or absence of the S1P receptor antagonist FTY-720 (from day 9, daily injection as described in the methods). Shown are representative dot plots (left) and quantification of the frequency and absolute numbers of tumor-infiltrating OT-I cells (right) four days after adoptive cell transfer. Graphs show the mean ± SEM of 2 independent experiments (n= 4-5).
(J-K) B16 tumors were injected into WT mice or Batf3−/− mice and treated with FL+pIC. Here mice received only 5 injections because CD103+ DCs reappear in Batf3−/− mice upon 9 FL injections. (J) Graph shows the mean tumor growth ± SEM of 2 independent experiments (n= 4-6). (K) B16 tumors were harvested on day 15. Bar graphs show the intratumoral T cell density as measured by flow cytometry (left) and CD8+ cell/Treg cell ratio (right) in Batf3−/− versus WT treated mice. Results are shown as the mean ± SEM of one experiment (n=4-5).
(L) B16 tumor-bearing mice treated with FL-pIC with with anti-CD4, anti-CD8, anti-NK1.1 Ab or control IgG as described in the method section. Graph shows the mean tumor growth ± SEM of 2 independent experiments (n=3-9).
See also Figure S5.

