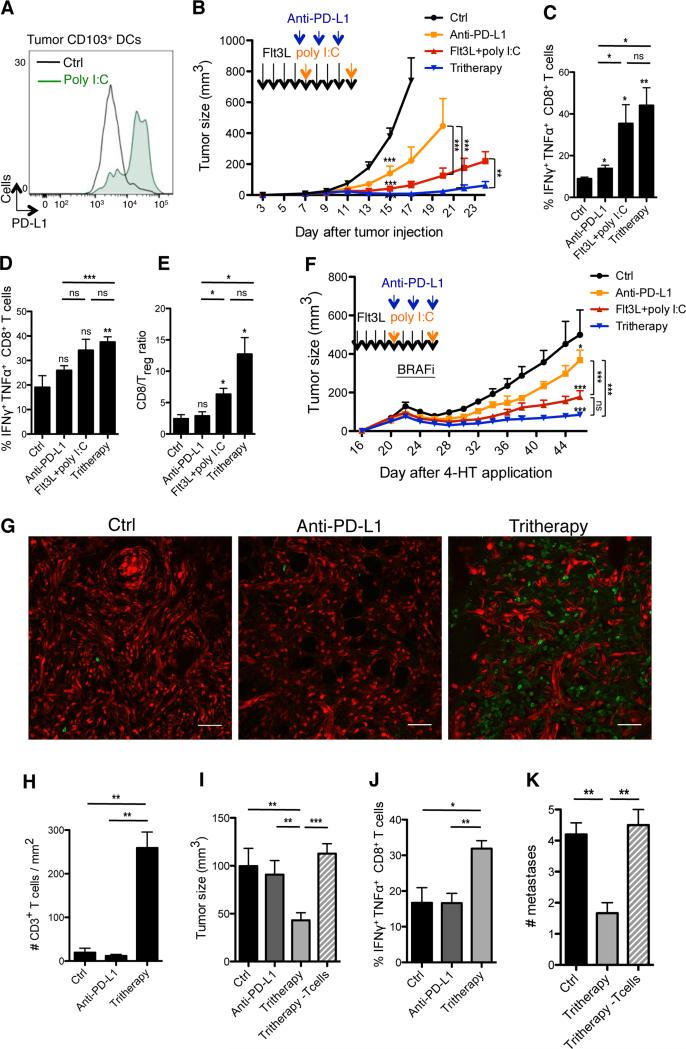
Figure 6. Flt3L and poly I:C synergize with anti-PD-L1 Ab treatment to enhance anti-tumor responses to BRAF inhibition.
(A) B16 tumors were injected with 50μg pIC or PBS, on days 7 and 11. Histograms show PD-L1 expression on tumor-infiltrating CD103+ DCs, 2 days after the last pIC or PBS injection with one representative example for each group.
(B) B16 tumor-bearing mice were treated with FL-pIC and injected with anti-PD-L1 mAbs or isotype control on days 7, 9 and 11 and assessed for tumor growth. Graph shows the mean tumor growth ± SEM of 3 independent experiments (n=5-10).
(C-E) B16 tumor-bearing mice were treated as in (B). On day 15, mice were sacrificed and CD8+ T cells isolated from the TdLN (C) or tumors (D) were analyzed for the production of IFNγ and TNFα. Shown is the mean ± SEM of 2 independent experiments (n=3-7). (E) Bar graph shows the intratumoral CD8+ cell/Treg cell ratio as the mean ± SEM of 2 independent experiments (n=3-7).
(F) Braf-mutant tumor-bearing mice were treated as indicated by the arrows. In addition to FL-pIC±anti-PD-L1 Ab therapy (or PBS and rat IgG as a control), all mice were treated with BRAF inhibitors (BRAFi) admixed chow for 4 days from day 22 to 26. Graph shows the mean tumor growth ± SEM of 2 independent experiments (n= 6-12).
(G-H) Tomato+ Braf-mutant tumor bearing mice were treated with the tritherapy, anti-PD-L1 Ab alone or PBS/IgG alone and re-challenged 4 weeks later with 4-HT on the other flank, as described in Figure S6A. (G) Representative confocal images of CD3+ T cells (green) infiltrating the re-challenged tumor. (H) T cell density quantified by histology using Cell Profiler software. Shown is the mean ± SEM of 2 independent experiments (n=3).
(I-J) Braf-mutant tumor and TdLN analyses were performed 4 weeks after the tumor re-challenge, as in (G). (I) Volume of the re-challenged tumors. (J) Proportions of CD8+ T in the LN draining the re-challenged tumor producing IFNγ and TNFα after PMA-ionomycin stimulation. Shown is the mean ± SEM of 2 independent experiments (n=5).
(K) Mice were treated as in Figure S6A and the number of skin tumors was assessed a month after the end of treatment. Bar graph shows the mean number of skin tumors ± SEM of 2 independent experiments (n=5-6).
See also Figure S6.

