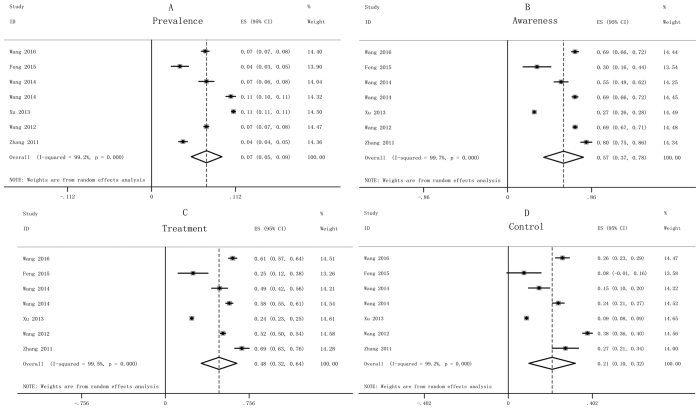
Figure 2.
Forest plots of prevalence (A), awareness (B), treatment (C) and control (D) of diabetes of all selected studies. The pooled prevalence of T2DM in Fig. 2A, the summarized awareness of T2DM in the Fig. 2B, the pooled treatment of T2DM in Fig. 2C, and the summarized control of T2DM in Fig. 2D.

