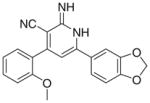
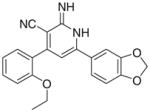
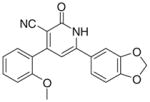
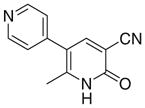
Table 1.
Inhibitory effect of the synthesized compounds on HT-29 cells and PDE3
| Compd # | Chemical structure | % Growth inhibition (at 50 μm) | Growth inhibition IC50 (μM) | % PDE3 inhibition (at 50 μm)
|
PDE3 inhibition IC50 (μM)
|
||
|---|---|---|---|---|---|---|---|
| cAMP | cGMP | cAMP | cGMP | ||||
| Ia |

|
75.03 | 50 | 16.32 | −15.46 | ND | |
| Ib |

|
98.68 | 35 | 3.57 | −19.78 | ND | |
| Ic |

|
−5 | NDa | 15 | 42 | ND | |
| Id |

|
99.78 | 13 | 37.92 | 125.53 | ND | 27 |
| Ie |

|
75 | 14.19 | 30 | 50 | ND | |
| If |

|
95 | 4.17 | 45 | 35 | ND | |
| Ig |

|
−20 | ND | 5 | 10 | ND | |
| Ih |

|
45 | ND | 18 | 3 | ND | |
| Ii |

|
91.25 | 3 | 19.04 | 26.25 | ND | |
| Ij |

|
87.68 | 12 | 45.91 | −8.99 | ND | |
| IIa |

|
13.59 | ND | 6.12 | 15.10 | ND | |
| IIb |

|
−20 | ND | 3 | 4 | ND | |
| IIc |

|
−25 | ND | 2 | −5 | ND | |
| IId |

|
2.81 | ND | 13.09 | 35.25 | ND | |
| IIe |

|
10.65 | ND | 4.76 | 10.79 | ND | |
| IIf |

|
0.00 | ND | 30 | 30 | ND | |
| IIg |

|
6.14 | ND | 32.31 | 49.64 | ND | |
| IIh |

|
−25 | ND | 8 | 20 | ND | |
| IIi |

|
8.28 | ND | 7.65 | 14.38 | ND | |
| IIj |

|
3.84 | ND | 10.54 | 22.30 | ND | |
| Milrinone |

|
0 | >50 | 77 | 95 | 11.4 | 3.6 |
ND: Not determined.
