Fig. 2.

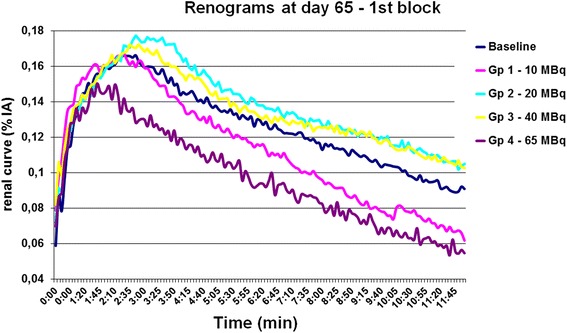
Renograms at follow-up examination at day 65. Renal dysfunction is reflected by decreased uptake and slope. Error bars not shown for clarity

Renograms at follow-up examination at day 65. Renal dysfunction is reflected by decreased uptake and slope. Error bars not shown for clarity