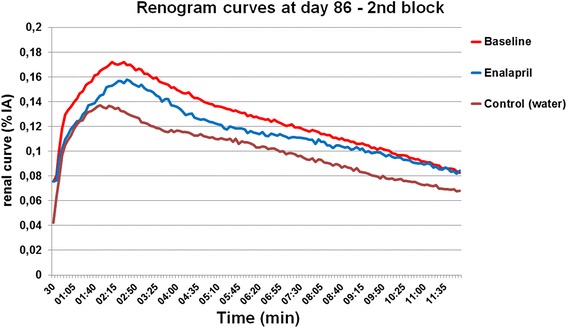
Fig. 5.

Renogram curves in the second part of the study at day 86. Both mean renogram curves in enalapril and control groups present a decreased peak value as compared to baseline, however, more pronounced in the control group. The flattening slopes indicate relatively higher renal damage in the water-treated control group as compared to the enalapril group. Regular slope in the enalapril group reveals normal renal excretion capacity
