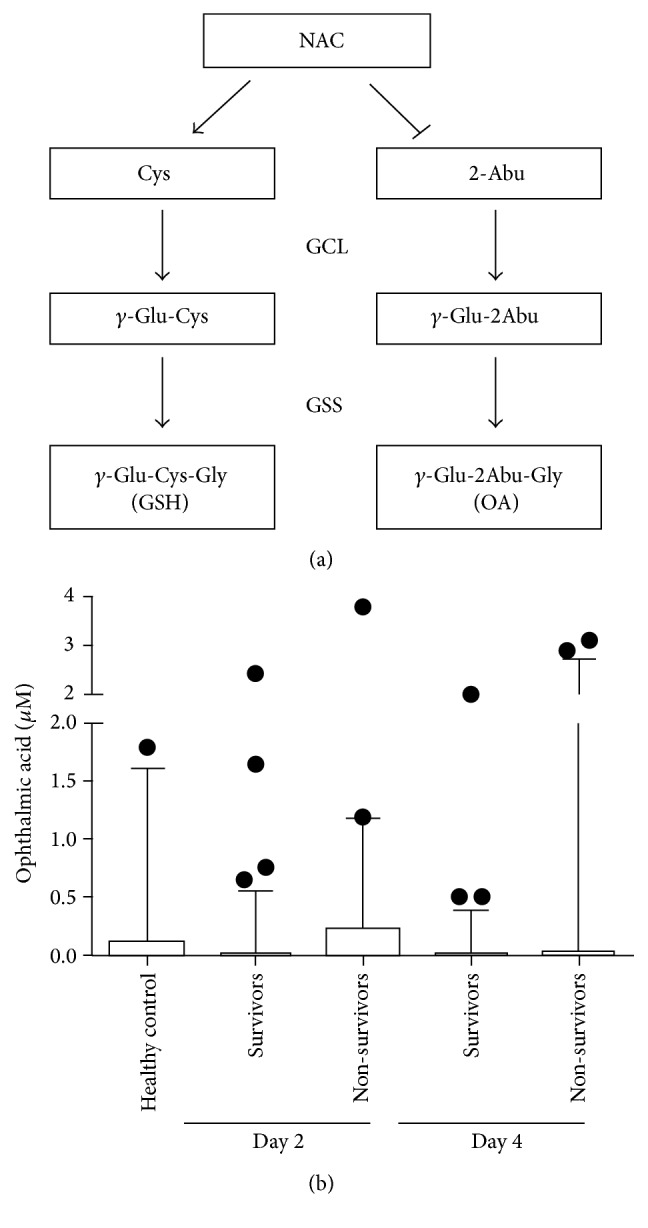
Figure 21.

Ophthalmic acid levels in healthy controls compared with surviving and non-surviving APAP-induced ALF patients at Day 2 (early) and Day 4 (late). Blood samples were collected for 130 patients with APAP-induced ALF on Day 2 and Day 4 after admission into hospital; at Day 21, there were 82 survivors and 48 non-survivors. Serum OA levels were quantified using UPLC-MS-MS. The data are shown as a Box and Whiskers plot with boxes representing the interquartile range, lines representing the entire range, and data points representing the outliers.
