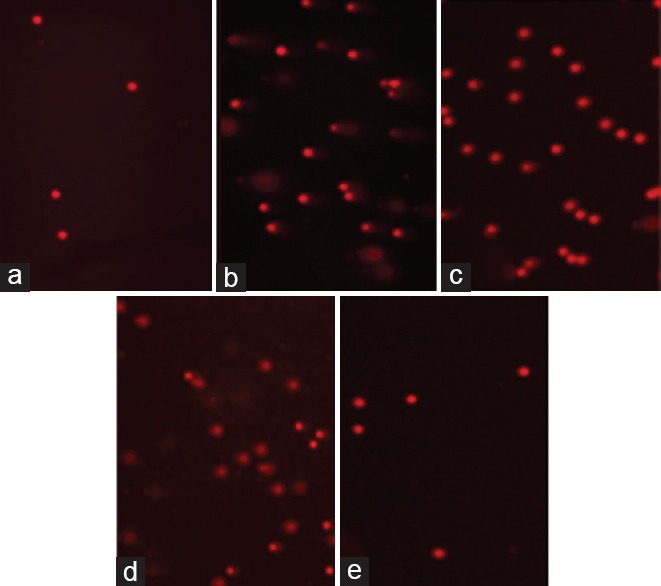
Figure 1.

Semi-quantitative analysis of renal injury in different treatment groupsComet assay. Control group (a). Potassium dichromate group (b). Melatonin-treated potassium dichromate group (c), caffeic acid phenethyl ester-treated potassium dichromate group (d), melatonin and caffeic acid phenethyl ester treated potassium dichromate group (e)
