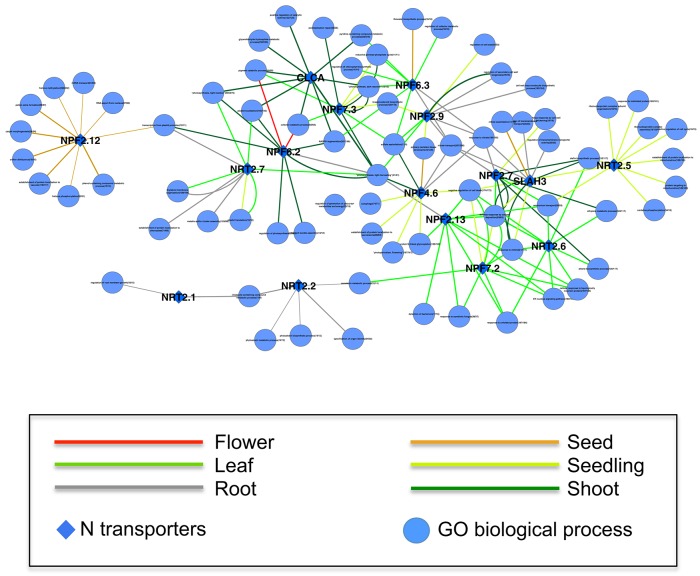
Figure 3.
A tissue-specific coexpression network between 17 N transporters and GeneOntology biological processes. Only the top 10 statistically significant coexpressed pathways coexpressed with each N transporter were included. The numbers following the name of GO biological process represent the number of genes within the process/the number of genes within the process and are on the microarray. The width of the edge is corresponding to the average weight of coexpression in GEO datasets of a specific tissue between the N transporter and genes from the GO category. Only the edges supported by at least 5 datasets of a specific tissue are shown here. A high resolution version of this figure and all the weights between N transporter and GO biological processes in all available tissues can be found in Supplemental Materials (Figure S4 and Table S6).

