
FIGURE 3.
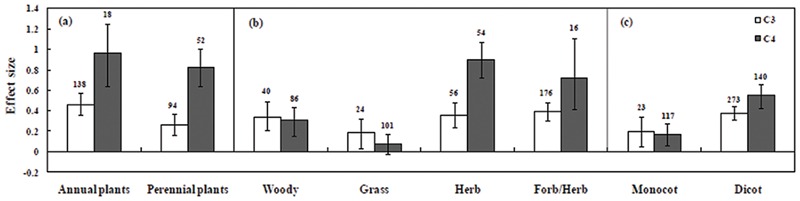
Arbuscular mycorrhizal fungi inoculation responses of plants under salt stress. Categorical analysis of (A) plant duration, (B) plant functional groups, and (C) plant types. Error bars are means ± bias CIs. Where the bias CIs do not overlap the horizontal, dashed lines, the effect size for a parameter is significant at P < 0.05. All effect sizes differed significantly from zero. The number of studies is shown above the bar.