
FIGURE 5.
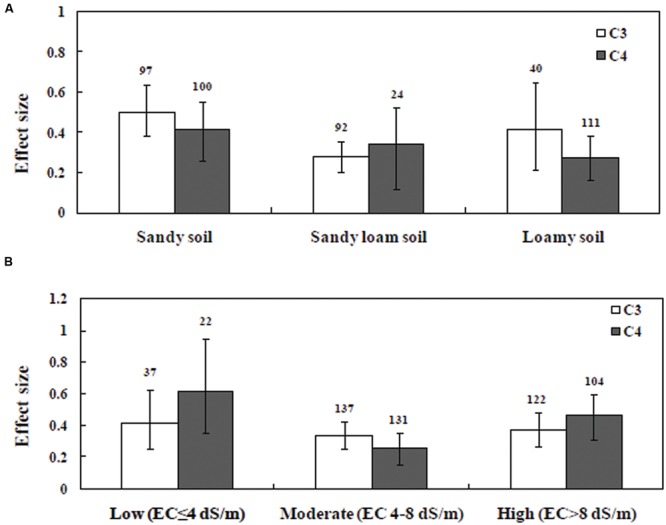
Arbuscular mycorrhizal fungi inoculation responses of plant under salt stress. Categorical analysis of (A) soil types (B) degree of salinity. Error bars are means ± bias CIs. Where the bias CIs do not overlap the horizontal dashed lines, the effect size for a parameter is significant at P < 0.05. The number of studies included for the meta-analysis is mentioned above the bar.