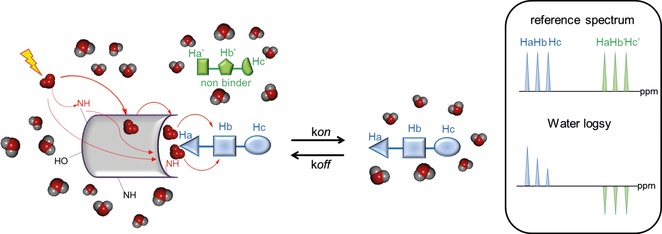
Figure 5.

Schematic representation of the waterLOGSY experiment. The different cross‐relaxation pathways are shown with red lines. High ligand/protein ratios should be avoided; otherwise, negative peaks would be observed even if the ligand is bound to the receptor, as the contribution from the free state would be predominant. Typically, protein/ligand ratios of 1:10 or 1:50 are chosen. Recording waterLOGSY spectra at low temperature, typically 5 °C, has been reported to give an improved signal‐to‐noise ratio.34
