
Figure 6.
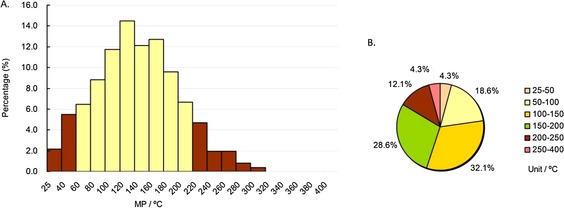
MP distributions of approved CNS drugs subdatabase. Column diagram (A), pie chart (B). Temperature ranges include the higher value but not the lower value, except for 25–40 °C and 25–50 °C, which include both (e.g., 40–60 °C contains 60 °C, but not 40 °C).