Figure 12.

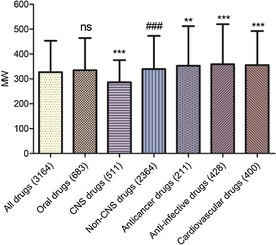
Mean MWs of different classes of drugs in our approved‐drug database; * compared with all drugs; ns, compared with all drugs; # compared with CNS drugs. Levels of significance, *** p<0.001; ** p<0.01; ### p<0.001; ns, no significance.

Mean MWs of different classes of drugs in our approved‐drug database; * compared with all drugs; ns, compared with all drugs; # compared with CNS drugs. Levels of significance, *** p<0.001; ** p<0.01; ### p<0.001; ns, no significance.