
Figure 4.
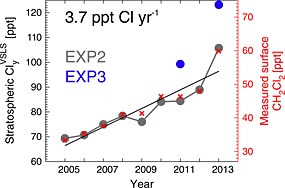
Time series of simulated annual mean total stratospheric chlorine from VSLS (sum of source and product gas contributions, filled circles, left axis). A linear trend line is applied to EXP2 which considered CH2Cl2, CHCl3, and C2Cl4, and the 2005–2013 mean growth rate (ppt Cl−1) is annotated. EXP3 (blue) also considered C2HCl3 and CH2ClCH2Cl. Also overlaid are annual mean CH2Cl2 mixing ratios (ppt) in the Northern Hemisphere calculated from NOAA surface observations (red crosses, right axis).