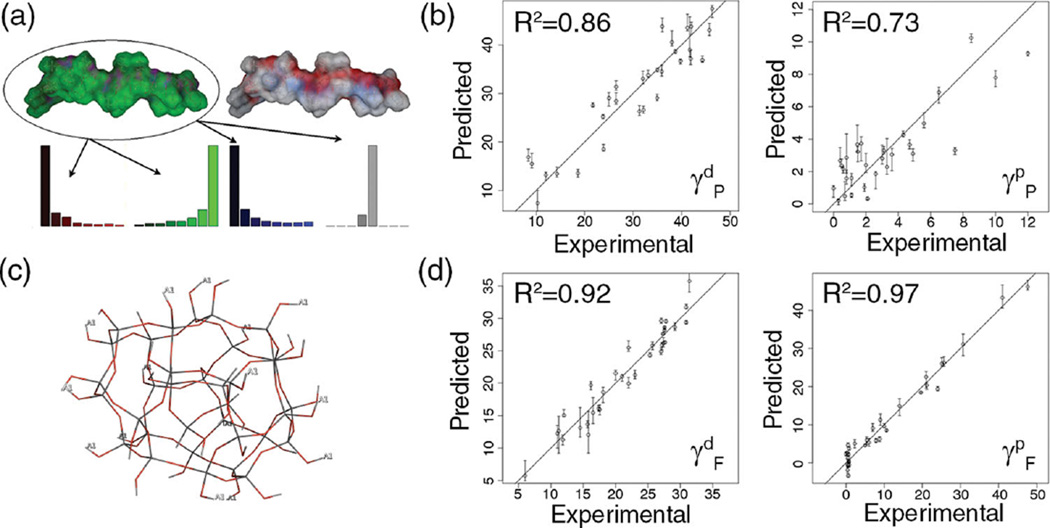
Figure 2.
a) Histogram descriptors for a 20-mer energy-minimized structure of poly(n-butyl acrylate), b) Correlation between experimental data and predicted data by bootstrap aggregate MQSPR model for polymers. Left: Dispersion. Right: Polar. c) Depiction of silica scaffold used to model filler particles. Hydrogens labeled with A1 indicate functional group attachment locations. d) Correlation between experimental data and predicted data by bootstrap aggregate MQSPR model for filler particles. Left: Dispersion. Right: Polar.

