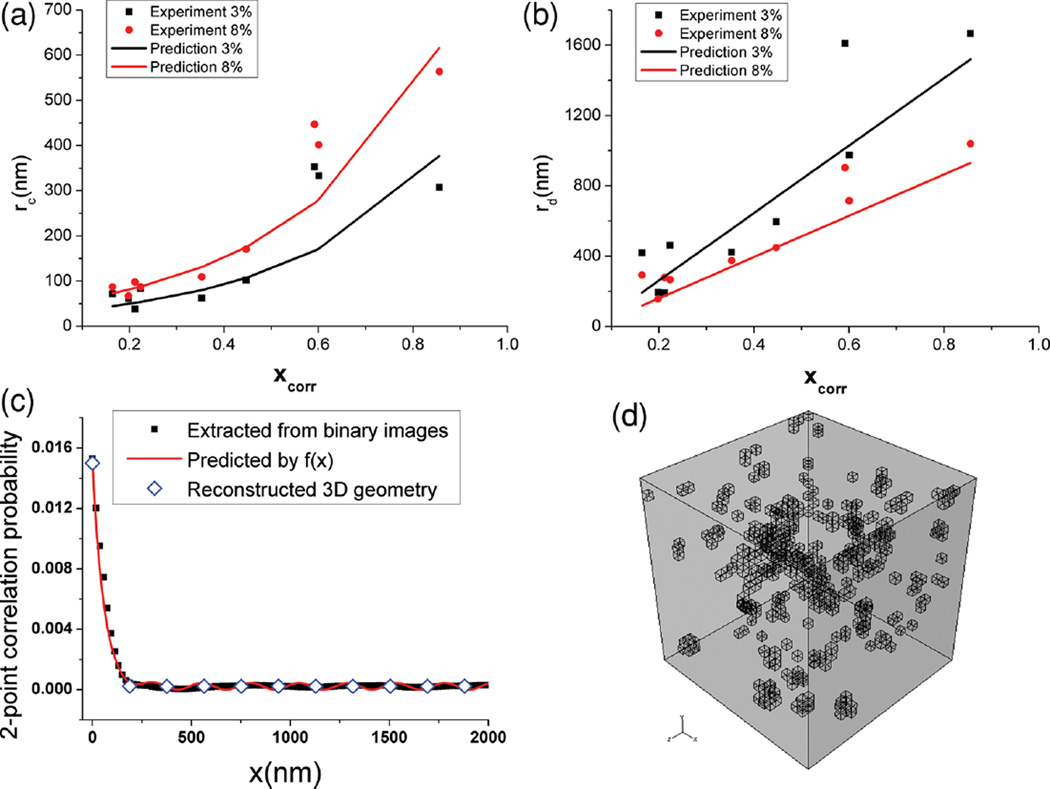
Figure 5.
a,b) Comparison between rc and rd obtained from analyzing TEM images from experiment and Equations (6) and (7). c) An example of the validation of the two-point correlation function constructed by Equation (4) with 3 wt% Octyl-Silica/PS. d) A 3D microstructure is then reconstructed in FEA with this two-point correlation function.

