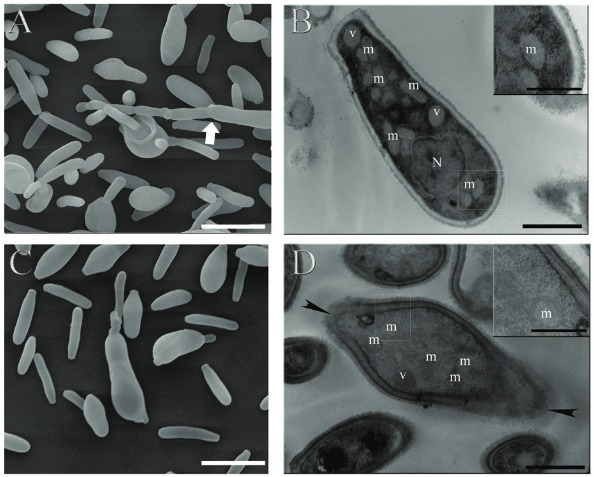
Fig. 2. : ultrastructural alterations of Sporothrix schenckii ATCC MYA 4821 on exposure to TCAN26, evaluated by scanning electron microscopy (A, C) and transmission electron microscopy (B, D). Control cells (untreated) exhibit yeasts and some hyphae cells (Fig. 2A, white arrow) while samples treated with 0.125 µg/mL TCAN26 for 24 h show only yeasts (Fig. 2C). Control cells exhibit homogenous and electron-dense cytoplasm containing nucleus (N), vacuoles (v), and several mitochondria (m), and are surrounded by the cell membrane and cell wall (Fig 2B and inset). TCAN26 exposure-induced reduction of cytoplasmic electron-density (Fig. 2D), disruption of cell membrane and cell wall (arrowheads in Fig. 2D) and increase in the cell wall thickness (inset in Fig. 2D) (Bars: A, C: 5 µm; B, D: 1 µm; insets in B and D: 0.5 µm).

