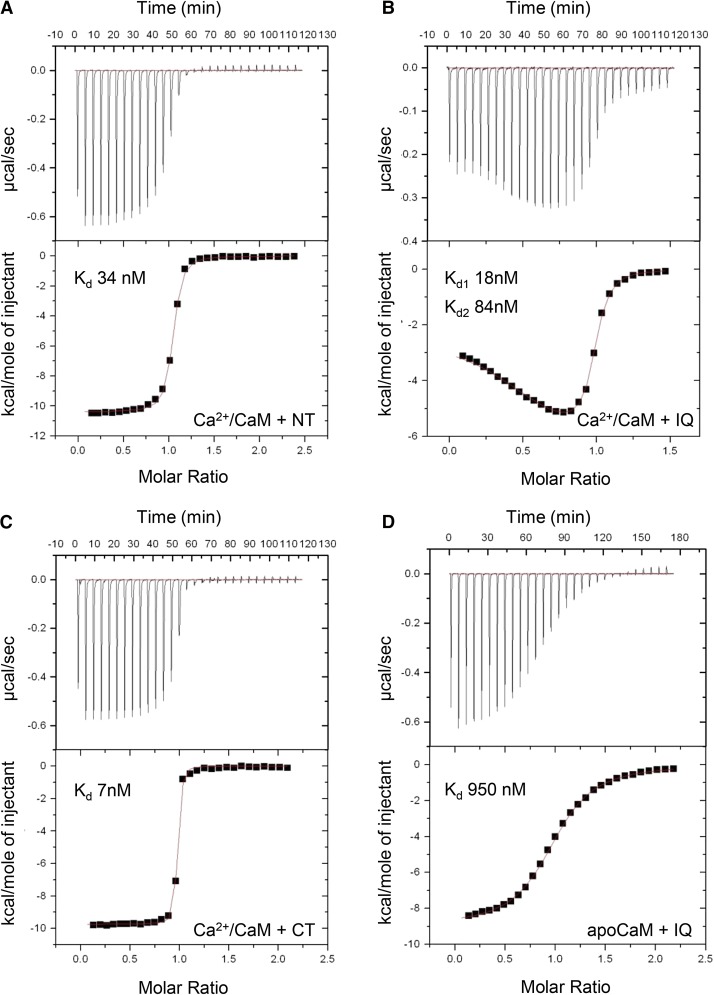
Figure 3.
ITC Analysis of Peptide-CaM Interactions.
For all experiments, calorimetric titrations (top panels) and the least-squares fitted model of binding are shown (bottom panels). Calculated Kd values are shown for each modeled binding site.
(A) Titration of 150 µM NT peptide into 16 µM CaM in the presence of 5 mM CaCl2.
(B) Titration of 205 µM IQ peptide into 20 µM CaM in the presence of 5 mM CaCl2.
(C) Titration of 150 µM CT peptide into 16 µM CaM in the presence of 5 mM CaCl2.
(D) Titration of 138 µM IQ peptide into 20 µM CaM in the presence of 1 mM EGTA.

