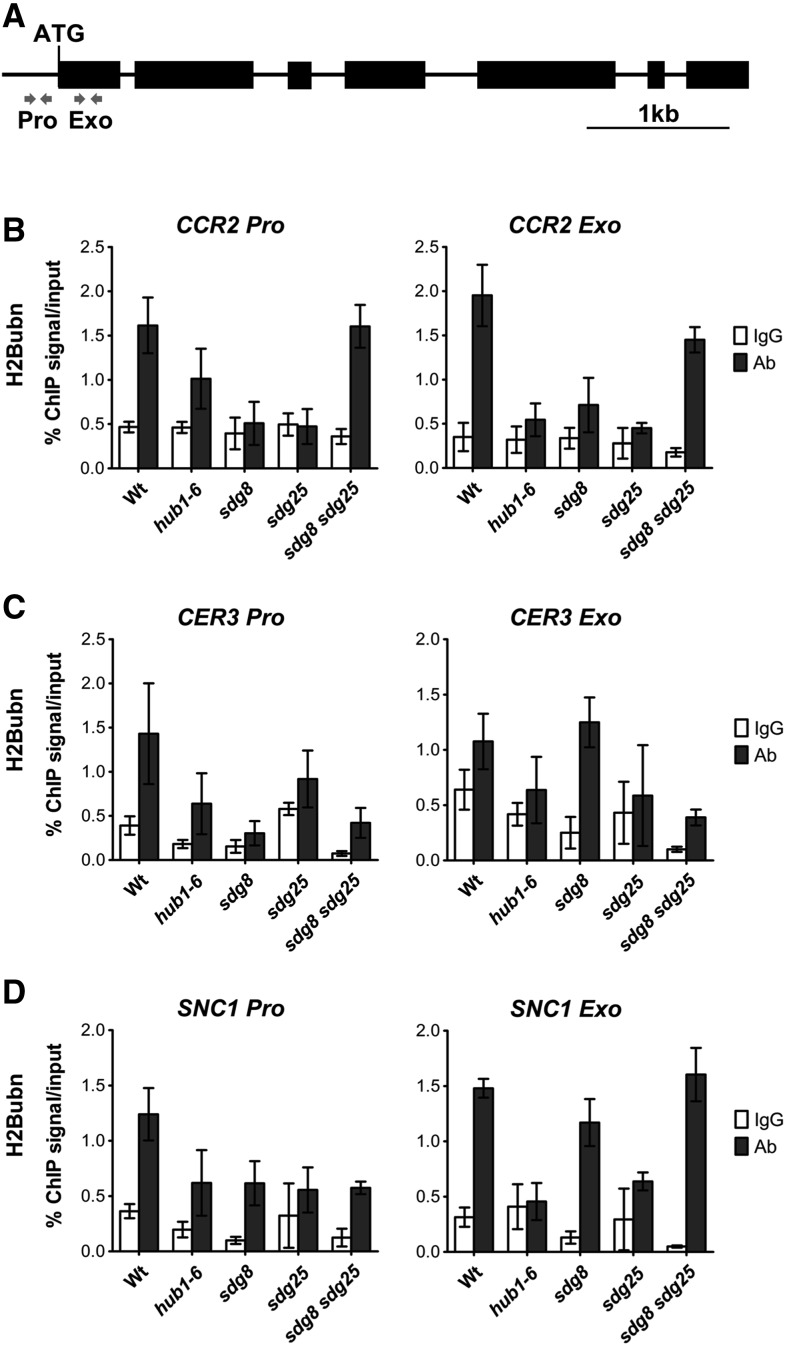
Figure 9.
Modulation of Histone 2B Monoubiquitination by Histone Lysine Methyl Transferases.
(A) Schematic of the genomic region of SNC1 and the location of the primers (gray arrows) at the promoter (Pro) and coding regions (Exo) are used to analyze the level of H2B monoubiquitination by ChIP assays. The solid lines indicate promoter and intron regions and black boxes indicate exons.
(B) to (D) Histone 2B ubiquitination is cross-regulated by histone lysine modification. Relative H2B monoubiquitination levels at chromatin of CCR2 (B), CER3 (C), and SNC1 (D). ChIP was conducted on chromatin extracts from the indicated plant genotypes with H2B monoubiquitination antibody and IgG was used as a background control. Data from each experiment were normalized to SAM and are presented as percentage of IP/input. Representative data from one experiment with three technical repeats are presented. Error bars show ±sd (n = 3). Similar results were obtained in at least two independent experiments. Wt, wild type; sdg8, sdg8-2; sdg25, sdg25-1.

