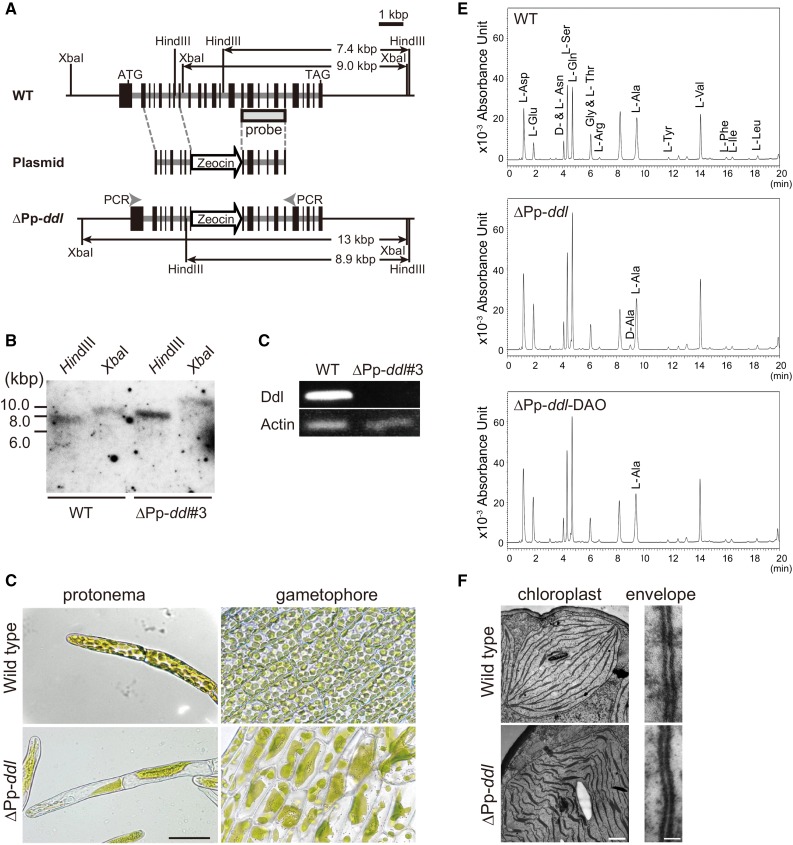
Figure 2.
Knockout of DDL Results in Macrochloroplasts in P. patens.
(A) Schematic representation of the DDL genomic region in wild-type (top) and knockout (∆Pp-ddl; bottom) P. patens. The plasmid constructed for gene disruption is shown in the middle (Plasmid), though the p35S-Zeo vector region is omitted. Start (ATG) and stop (TAG) codons are indicated. Exons are indicated by black boxes. The arrow labeled “Zeocin” indicates the Zeocin cassette. The probe region and the predicted sizes of restriction fragments detected in the DNA gel blot analyses are given. The locations of the RT-PCR primers for (C) are also indicated in the DDL knockout genome.
(B) The results of DNA gel blot analysis with the DDL probe are shown. Genomic DNA from the wild-type and ∆Pp-ddl#3-knockout plants was digested with HindIII or XbaI.
(C) Pp-DDL expression in wild-type and the knockout plants was examined by RT-PCR. Pp-Actin was used as an internal control.
(D) Phenotype of ∆Pp-ddl#3. Micrographs of protonema and leaf cells from wild-type and Pp-DDL-knockout plants are shown at the same magnification. Bar = 50 µm.
(E) UPLC analysis of P. patens cells. Protonema cells of wild-type and ∆Pp-ddl plants were used. DAO from porcine kidney was used for the degradation of d-amino acids from ∆Pp-ddl plants. For details of the chromatography procedure, see Methods.
(F) Electron micrographs of the chloroplasts (bar = 500 nm) and chloroplast envelopes (bar = 20 nm) of wild-type and ∆Pp-ddl plants. The right side of the envelopes is the cytoplasm region.

