Figure 1.
Arabidopsis HLS1 Mediates Responses to Fungal and Bacterial Pathogens.
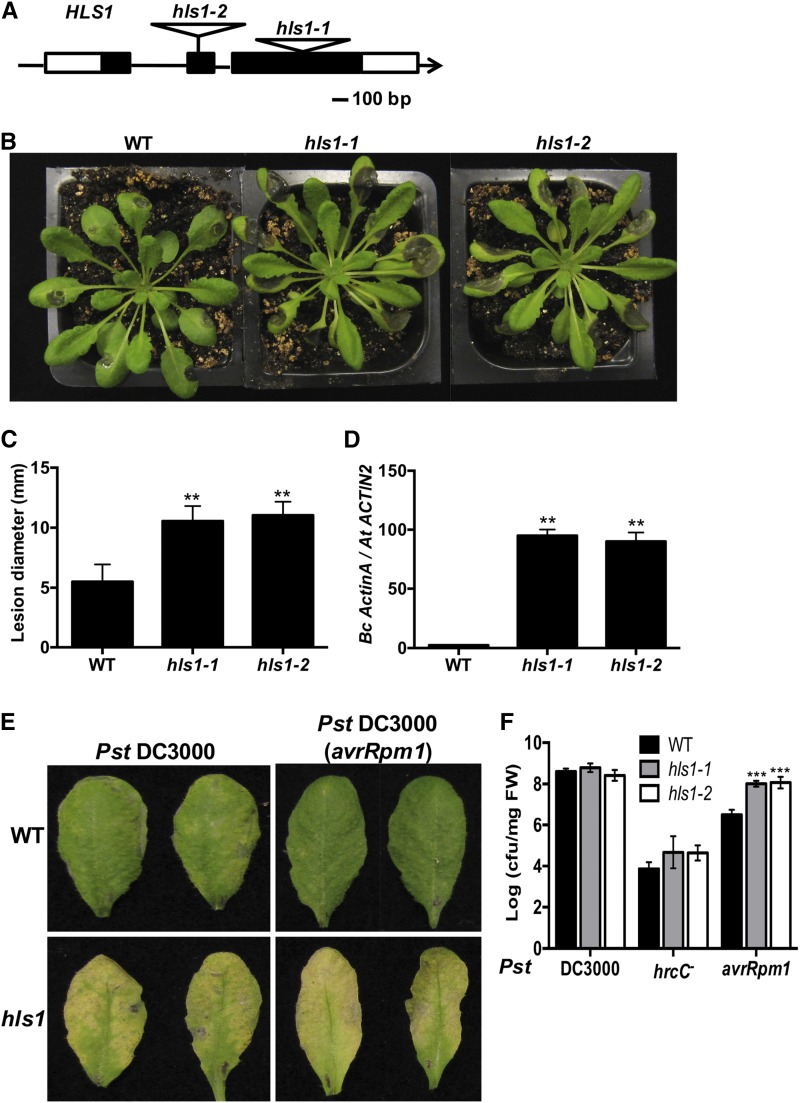
(A) Schematic diagram showing T-DNA insertion alleles of the HLS1 gene. HLS1 gene and T-DNA insertions are shown in the hls1 mutant alleles. Black and white squares are exons and untranslated regions, respectively.
(B) B. cinerea disease symptoms showing susceptibility of hls1 mutant and
(C) Disease lesion size in the wild-type and hls1 mutants. The data represent mean values ± sd from (n = 36).
(D) Enhanced B. cinerea growth in hls1 mutants as measured by qPCR. Fungal growth was determined by qPCR amplification of the B. cinerea ActinA gene relative to Arabidopsis ACTIN2 gene. The data represent mean values ± se (n = 3).
(E) Enhanced disease symptoms in hls1 mutant after inoculation with Pst strain. Inoculated leaves were detached for photographing at 3 days after inoculation (dai). Plants were infiltrated with a bacterial suspension (OD600 = 0.0005, ∼2.5 × 10⁵ CFU/mL).
(F) Bacterial growth in the wild-type and hls1 mutants showing altered responses to bacterial infection. Bacterial growth is expressed in colony-forming units per mg fresh weight (cfu/mg FW). The data represent mean values ± sd (n = 24).
In (C), (D), and (F), the mean values with statistically significant differences are indicated by asterisks (ANOVA test: **P < 0.01 and ***P < 0.001). The experiment was repeated three times with similar results.

