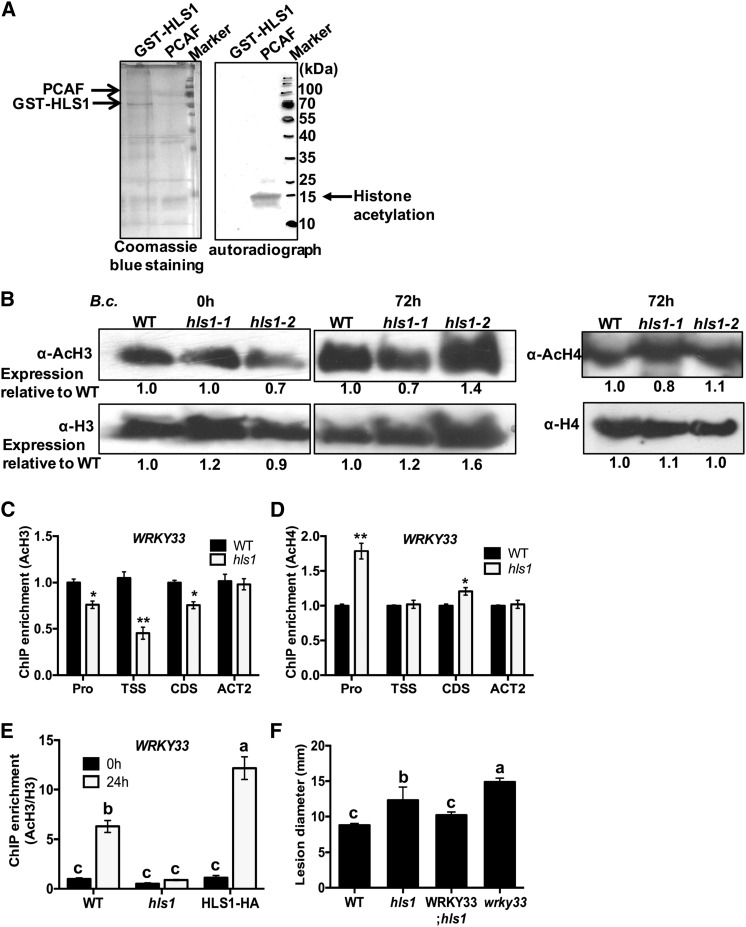
Figure 4.
HLS1 Modulates Histone H3 Acetylation on WRKY33 Chromatin.
(A) Histone acetyltransferase activity assay with recombinant GST-HLS1. The recombinant protein expressing full-length HLS1 tagged with GST (GST-HLS1) was produced in E. coli and affinity purified. The recombinant acetyltransferase PCAF protein was used as a positive control in the HAT assay. The chicken core histone used as substrate was obtained from Millipore. The recombinant GST-HLS1 protein run on 15% SDS-PAGE gel and stained with Coomassie blue is shown as a loading control (left panel). The H3-labeled acetyl-CoA was detected on acetylated histones by autoradiography. The autoradiograph shows that PCAF, but not HLS1, transferred acetyl groups labeled with H3 from acetyl-CoA to core histones.
(B) Global H3 and H4 acetylation is not altered in hls1 mutant plants. Histone proteins were extracted from plants inoculated with B. cinerea. The global histone H3, acetyl-histone H3, histone H4, and acetyl-histone H4 accumulations were detected using specific antibodies as indicated. The signals on immunoblots were quantified by ImageJ software and numbers are shown corresponding to each lane on the blot.
(C) and (D) ChIP-qPCR showing histone H3 (C) and H4 (D) acetylation at WRKY33 chromatin. ChIP-qPCR was performed using antibodies that recognize acetylated histone H3 or H4. The different regions of WRKY33 were amplified by qPCR. The enrichment of WRKY33 in wild-type plants was set to 1 as a background control in ChIP-qPCR assay. The data represent mean values ± se (n = 3). Statistically significant differences are indicated by asterisks (Student’s t test: *P < 0.05 and **P < 0.01).
(E) Histone H3 acetylation at WRKY33 chromatin is enhanced in B. cinerea-inoculated plants. The chromatin complexes were collected from wild-type, hls1 mutant, and HLS1-HA plants at 0 or 24 h after B. cinerea inoculation. The H3 acetylation status is normalized with histone H3 from each sample. The enrichment of WRKY33 in the wild type at 0 h is set to 1 as a background control in the assay. The data represent mean values ± se (n = 3). Statistically significant differences are marked by different letters (least squares means post hoc test: P < 0.05).
(F) Overexpression of WRKY33 restored the disease susceptibility of the hls1 mutant to wild-type levels. The data represent mean disease lesion size ± se (n = 12). The statistical significance of the differences in the mean values is indicated by different letters (least squares means post hoc test: P < 0.05). The experiment was repeated at least two times with similar results.
Pro, promoter region; WRKY33; hls1, overexpressing WRKY33 in the hls1 mutant background.

