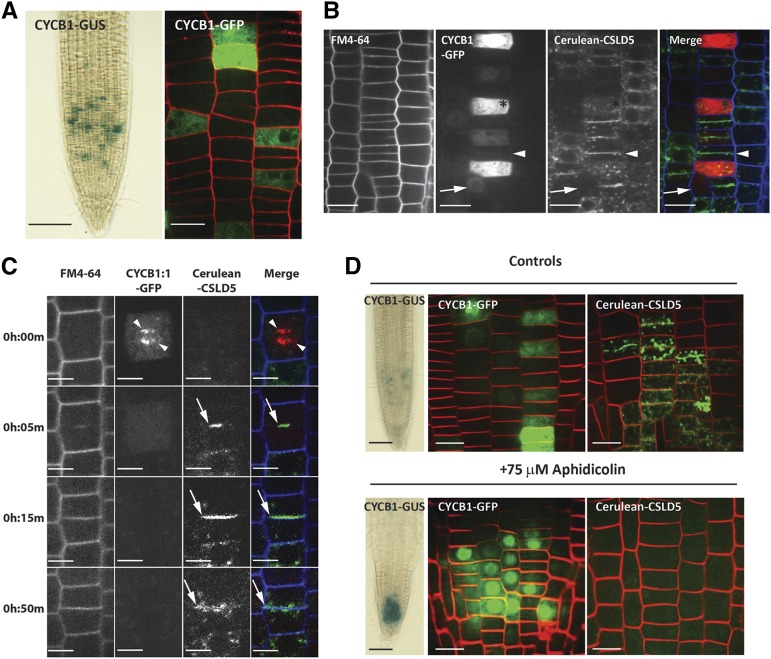
Figure 4.
CSLD5 Accumulation Is Regulated by the Cell Cycle.
(A) Representative images of the distribution of a CYCB1-GUS translational fusion (left panel) and CYCB1-GFP (right panel) in root meristematic zones (green = CYCB1-GFP; red = FM4-64).
(B) The distribution of CYCB1-GFP (red) and Cerulean-CSLD5 (green) in 5-d-old seedlings stained with FM4-64 (blue). Cerulean-CSLD5 was largely absent from cells containing significant levels of CYCB1-GFP (arrows). CYCB1-GFP was absent from the cells with Cerulean-CSLD5 fluorescence on cell plates (arrowheads).
(C) CYCB1-GFP and Cerulean-CSLD5 dynamics during mitosis. Five-day-old seedlings expressing CYCB1-GFP and Cerulean-CSLD5 were examined by time lapse video microscopy. Cell peripheries of root epidermal cells were labeled by a 5-min pulse of FM4-64 (blue). CYCB1-GFP (red) initially labeled chromatids at the metaphase-anaphase transition (arrowheads; 0 h:00 m time point), but CYCB1-GFP signal was rapidly lost upon transition to cytokinesis (0 h:05 m time point). Only after CYCB1-GFP signal disappeared was Cerulean-CSLD5 observed in newly forming cell plates (arrow, 0 h:05 m and 0 h:15 m time points). Upon completion of cytokinesis, Cerulean-CSLD5 signal was depleted from the newly formed dividing cell wall and appeared in punctate cytoplasmic compartments (arrow; 0 h:50 m time point).
(D) Cerulean-CSLD5 does not accumulate in early S-phase. Treatment with 75 µM aphidicolin for 48 h locked the cell cycle in early S-phase, resulting in proliferation of cells containing CYCB1-GUS (left panels) or CYCB1-GFP (middle panels), but no Cerulean-CSLD5 signal could be detected in root epidermal cells treated with aphidicolin (right panels).
Bars = 1 mm in (A) and (D) for CYCB1-GUS, 20 μm in (A), (B), and (D) for CYCB1-GFP, and 20 μm in (B), 10 μm in (C), and 20 μm in (B) and (D) for Cerulean-CSLD5.

