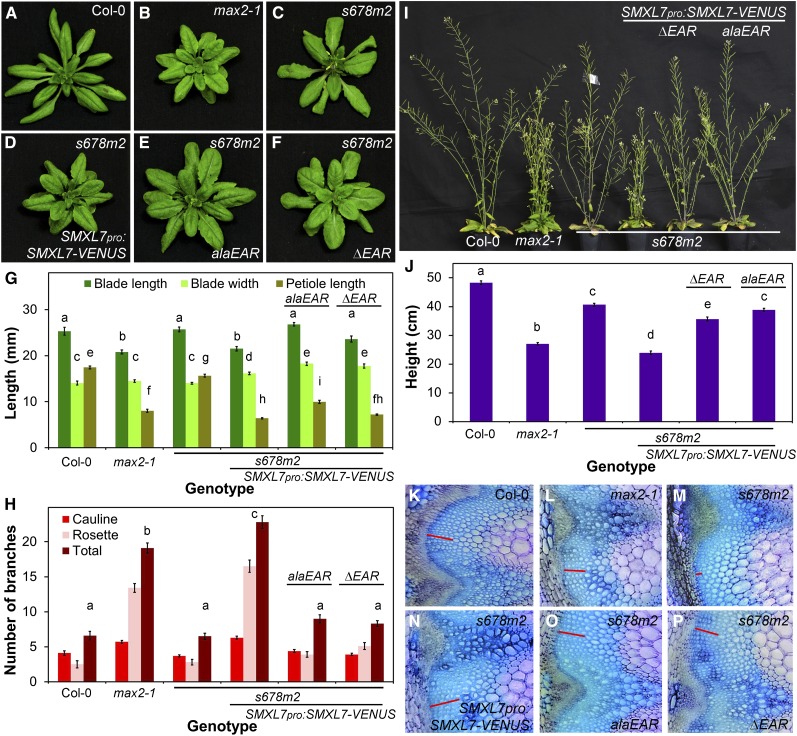
Figure 8.
Phenotypic Effects of SMXL7 Are Partially EAR-Independent.
(A) to (F) Rosette leaf morphology in Col-0 (A), max2-1 (B), untransformed smxl6-4 smxl7-3 smxl8-1 max2-1 (s678m2) (C), or s678m2 homozygous for SMXL7pro:SMXL7-VENUS (D), SMXL7pro:SMXL7alaEAR-VENUS (E), and SMXL7pro:SMXL7ΔEAR-VENUS (F).
(G) Leaf blade length, blade width, and petiole length in the 7th leaf of Col-0, max2-1, untransformed smxl6-4 smxl7-3 smxl8-1 max2-1 (s678m2), or s678m2 homozygous for SMXL7pro:SMXL7-VENUS, SMXL7pro:SMXL7alaEAR-VENUS, and SMXL7pro:SMXL7ΔEAR-VENUS. n = 10; error bars indicate se; bars with the same letter are not significantly different from one another (ANOVA + Tukey HSD, P < 0.05).
(H) Number of cauline, rosette, and total primary branches of Col-0, max2-1, untransformed smxl6-4 smxl7-3 smxl8-1 max2-1 (s678m2), or s678m2 homozygous for SMXL7pro:SMXL7-VENUS, SMXL7pro:SMXL7alaEAR-VENUS, and SMXL7pro:SMXL7ΔEAR-VENUS. n = 10; error bars indicate se; bars with the same letter are not significantly different from one another (ANOVA + Tukey HSD, P < 0.05).
(I) Adult shoot morphology in (left to right) Col-0, max2-1, untransformed smxl6-4 smxl7-3 smxl8-1 max2-1 (s678m2), or s678m2 homozygous for SMXL7pro:SMXL7-VENUS, SMXL7pro:SMXL7ΔEAR–VENUS, and SMXL7pro:SMXL7alaEAR-VENUS.
(J) Height of the primary inflorescence stem in Col-0, max2-1, untransformed smxl6-4 smxl7-3 smxl8-1 max2-1 (s678m2), or s678m2 homozygous for SMXL7pro:SMXL7-VENUS, SMXL7pro:SMXL7alaEAR-VENUS, and SMXL7pro:SMXL7ΔEAR-VENUS, measured at proliferative arrest. n = 10; error bars indicate se; bars with the same letter are not significantly different from one another (ANOVA + Tukey HSD, P < 0.05).
(K) to (P) Stem anatomy in Col-0 (K), max2-1 (L), untransformed smxl6-4 smxl7-3 smxl8-1 max2-1 (s678m2) (M), or s678m2 homozygous for SMXL7pro:SMXL7-VENUS (N), SMXL7pro:SMXL7alaEAR-VENUS (O), and SMXL7pro:SMXL7ΔEAR-VENUS (P) plants stained with toluidine blue. Red bar illustrates the depth of the interfascicular cambium layer. Images are representative of multiple independent samples.

