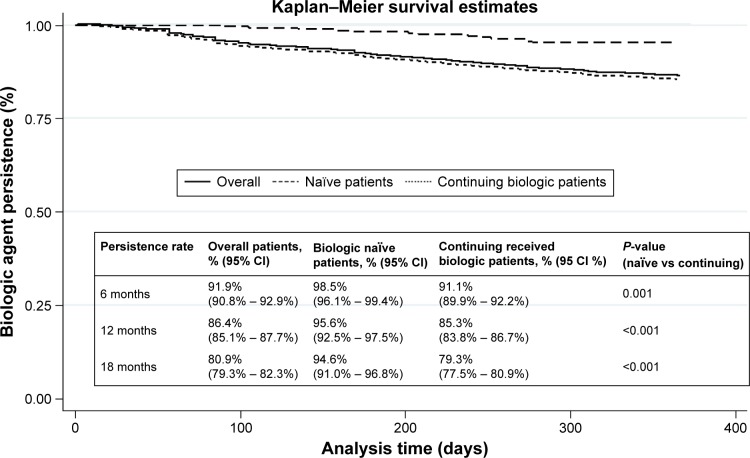
. 2016 Aug 5;10:1509–1519. doi: 10.2147/PPA.S110147
© 2016 Mahlich and Sruamsiri. This work is published and licensed by Dove Medical Press Limited
The full terms of this license are available at https://www.dovepress.com/terms.php and incorporate the Creative Commons Attribution – Non Commercial (unported, v3.0) License (http://creativecommons.org/licenses/by-nc/3.0/). By accessing the work you hereby accept the Terms. Non-commercial uses of the work are permitted without any further permission from Dove Medical Press Limited, provided the work is properly attributed.

