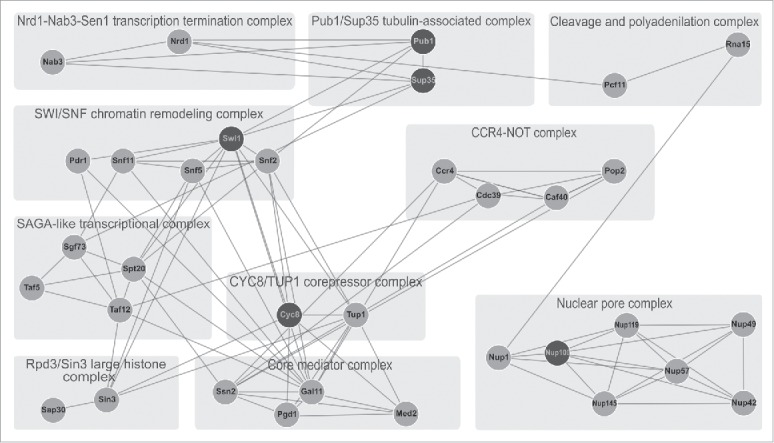
FIGURE 2.

Q/N-rich subunits of protein complexes in S. cerevisiae and their interactions. Shown is the interactome of Q/N-rich subunits of protein complexes containing more than one Q/N-rich subunit. Lines indicate physical protein-protein interactions (according to data from “String” database, http://string-db.org/). Experimentally proven prion and amyloid-forming proteins are indicated by black circles, while other Q/N-rich proteins are indicated by gray circles. Light gray rectangles indicate corresponding protein complexes (including their names, as indicated).
